Mobile Marketing
Global Smart Phone Shipments By OS, Q2 2011 & Q2 2012 [TABLE]
Symbian shipped 18 million smart phones in the second quarter of 2011. But one year later, that number had dropped to 6.8 million.
Read MoreTop 5 Global Mobile Phone Manufacturers, 2011 & 2012 [TABLE]
Samsung accounted for 29% of worldwide cell phone shipments in 2012—up five percentage points from last year.
Read MoreOnline Shopping Behavior Of The Wealthy, December 2012 [TABLE]
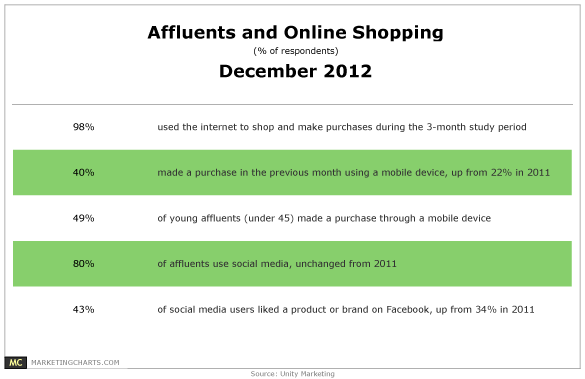
Virtually all (98%) affluent consumers use the internet to shop and make purchases.
Read MoreeMoney [INFOGRAPHIC]
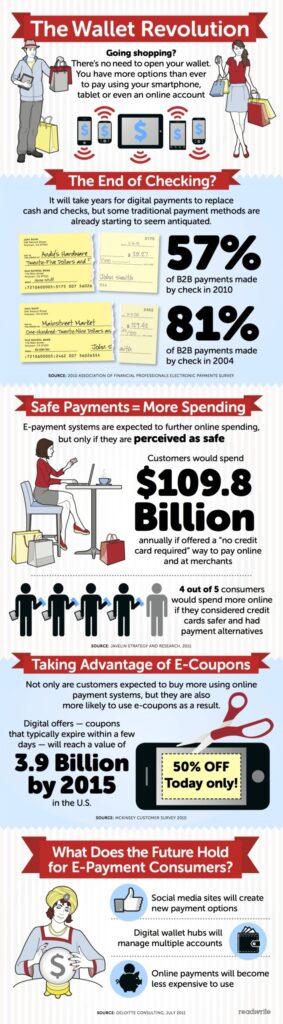
This ReadWrite infographic offers some key data points on the path to digital money.
Read MoreTime Spent Online By Activity & Device, 2012 [CHART]
Social media captures 31% of smartphone internet time, compared to 18% of PC internet time.
Read MoreTime Spent Online By Device, 2011 vs 2012 [CHART]
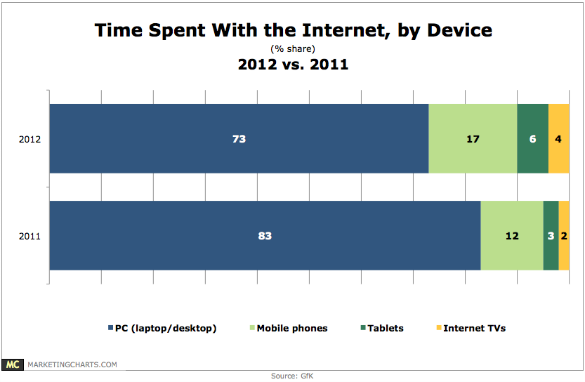
While desktop and laptop computers accounted for 83% of total time spent online last year, that dropped by 10% points to 73% this year.
Read MoreMobile Gaming By Time Of Day, December 2012 [CHART]
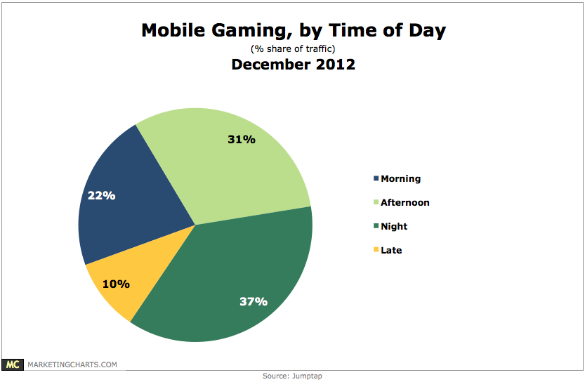
Mobile gamers place a high level of value on the experience gaming provides and they’re most likely to want to have that experience at night time.
Read MoreGlobal eReader Shipments, 2010-2016 [CHART]
IHS iSuppli projected in December eBook reader shipments to fall this year to 14.9 million units—a decline of 36% from 2011’s 23.2 million units shipped.
Read MoreGlobal Connected Device Shipments, 2011-2016 [CHART]
In Q3 2012, worldwide shipments of smart connected devices—a category that includes PCs, tablets and smartphones—increased by 27.1% year over year.
Read MoreUS Travelers' Online Transactions By Device & Travel Category, August 2012 [CHART]

More than half of these US travelers purchased hotel reservations via laptop, while only 17% booked hotels via tablet, and 11% via smartphone.
Read More