Mobile Marketing
Global Facebook Ad Revenues By Segment, 2012-2018 [CHART]
Research firm Cowen and Company estimated in January that this year, Facebook’s total worldwide ad revenues would reach $6 billion, with $1.7 billion coming from mobile.
Read MoreGlobal Facebook Advertising CPC Rates By Device, December 2012 [CHART]
Cost-per-click on mobile ads was $1.38 vs. 81 cents on desktop, according to Kenshoo Social.
Read MoreGlobal Facebook Ad Spending By Device & OS, December 2012 [CHART]
Breaking down how that mobile spending was distributed by device, the company found, unsurprisingly, that on smartphones, Android received the bulk of Facebook ad spend, at 71%, while on tablets, nearly all Facebook mobile advertising revenues went to iOS devices.
Read MoreGlobal Facebook Ad Spending By Device, December 2012 [CHART]
Already, in December 2012, one in five advertiser dollars on Facebook went to mobile.
Read MoreCustomer Insights Via Social Media, January 2013 [CHART]
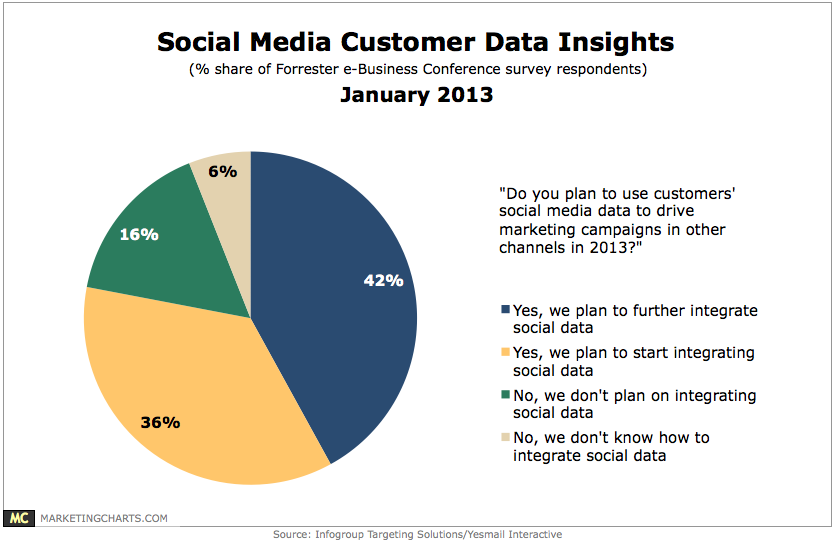
4 in 5 marketers said they plan to use customers’ social media data to drive marketing campaigns in other channels this year.
Read MoreMobile Use By Luxury Brand Shoppers, January 2013 [CHART]

59% of luxury brand shoppers say they’ve used mobile to interact with a company.
Read MoreMobile Search Engine Traffic Market Share, Q4 2012 [CHART]
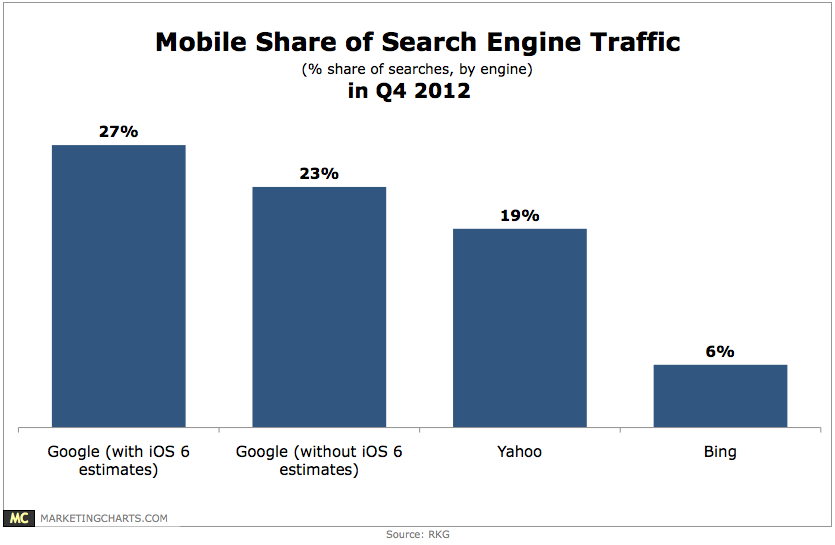
Mobile activity on Google far outpaced Yahoo and Bing.
Read More
American Mobile Buyers, 2011-2016 [CHART]
Retail trends and the latest research leads eMarketer to believe that 72 million people in the US will make a purchase through a mobile device in 2013.
Read MoreUS Mobile Shopping Penetration, 2011-2016 [CHART]
eMarketer forecasts the number of mobile shoppers in the US will increase by 24% in 2013 to 118 million consumers and represent 62% of digital shoppers.
Read More