Mobile Marketing
Most Common Mobile Phone Ad Dimensions, H1 2012 [INFOGRAPHIC]
US advertisers will spend $2.2 billion on mobile display advertising in 2013 and diversify investments across a wider range of ad formats.
Read MoreThe Economic Impact Of Mapping [INFOGRAPHIC]
Google put together this infographic to illustrate some examples of the benefits of maps.
Read MoreMarketing Strategies Gaining Favor In 2013 [CHART]
More than eight in 10 of those polled named mobile media as a target for increased focus, while just over three-quarters of respondents said the same for social media.
Read MoreInstagram User Demographics [TABLE]
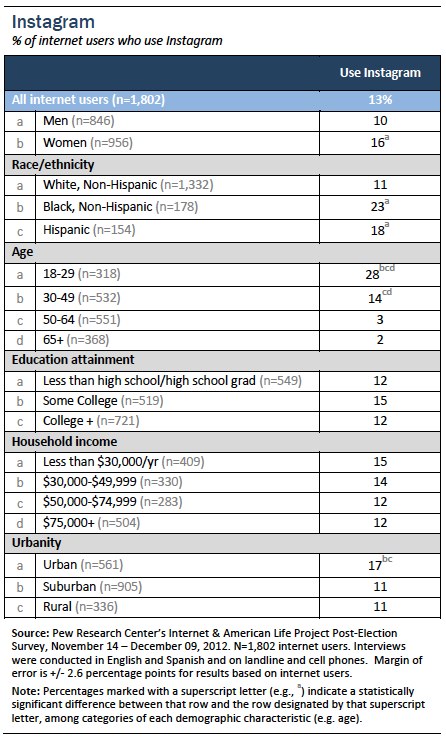
Thirteen percent of internet users are taking and sharing pictures with Instagram.
Read MoreTwitter User Demographics [TABLE]
The percentage of internet users who are on Twitter has doubled since November 2010, currently standing at 16%.
Read MoreConnected TV & Mobile Penetration, 2011-2016 [CHART]
Smart phone penetration in the world’s top 19 digital markets is expected to double from 35.5% last year to an average of 71.7% in 2015.
Read MoreMobile Purchases By Device, February 2013 [CHART]
More than 6 in 10 smartphone and tablet owners have purchased download media such as ringtones, e-books, and games via their device.
Read MoreUS Location-Based Mobile Ads By Industry, 2012 [CHART]

100% of the studied mobile campaigns in the grocery, political, health care, lottery, real estate and education industries used location info of some sort.
Read MoreUS Location-Based Mobile Advertising By Target, 2012 [CHART]
The percentage of location-based ad campaigns using geofencing or geoaware targeting had more than doubled, from 17% in 2011 to 36% in 2012.
Read MoreFinancial Activities On Mobile Devices By Device Type, February 2013 [CHART]
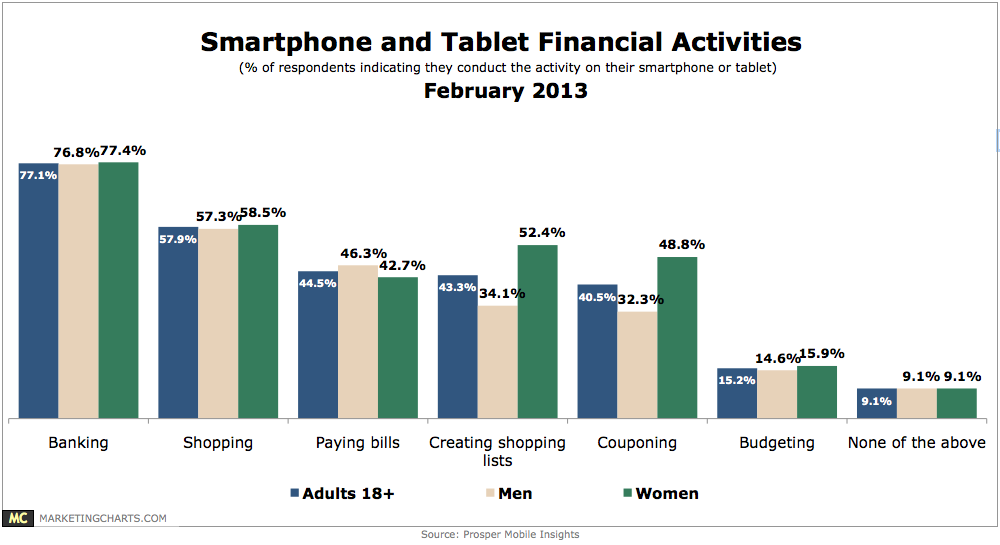
Slightly more than 9 in 10 smart phone and tablet users engage in one or more of a variety of financial activities on their devices.
Read More