Mobile Marketing
Video Viewership Trends, Q3 2010 – Q3 2012 [TABLE]

In Q3, 2012, there were 5.3 million broadcast-only and broadband homes, up from around 5.1 million in Q3 2011 and 4.2 million in Q3 2010.
Read MoreHoliday Multi-Screen Shopping, 2012 [TABLE]

63% of shoppers used multiple devices to help with their holiday purchases last year.
Read MoreVideo Buffering Problems By Device, 2012 [CHART]
Almost 55% of online video views on iOS devices had a problem with buffering, compared to 50% of video views on Xbox, 49% on Android, and only 36% on PCs using Flash.
Read MoreMobile Marketing Budget Plans, February 2013 [CHART]
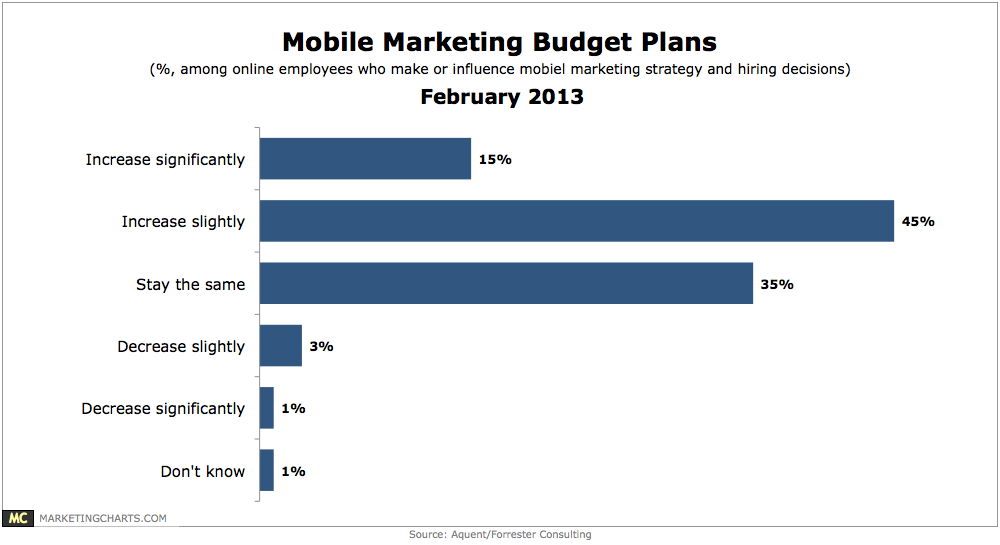
6 in 10 marketers said they expect their mobile marketing budgets to increase significantly (15%) or slightly (45%).
Read MoreMobile Operating System Market Share, 2011 vs 2012 [CHART]
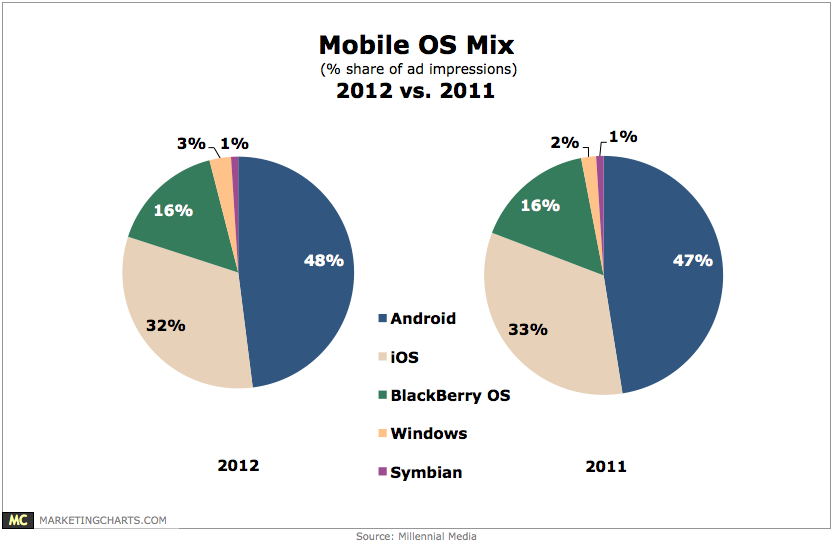
With 75% share of total ad impressions, the smart phone share grew by 7% points from 2011.
Read MoreSearch Advertising Cost Per Click By Device, Q4 2011 – Q4 2012 [TABLE]
US advertisers will increase mobile search ad spending 80.6% this year to $3.54 billion, up from $1.99 billion in 2012.
Read MoreSearch Ad Spending Share By Device & Search Engine, Q4 2011 – Q4 2012 [TABLE]

On desktops, Google captured more than four-fifths of search spending in the last quarter measured.
Read MoreSearch Advertising Click Share By Device, Q4 2011 – Q4 2012 [CHART]
The share of paid clicks coming from smart phone and tablet devices nearly doubled between Q4 2011 and Q4 2012.
Read MoreHow Mobile Affects Local Marketing Mix [CHART]
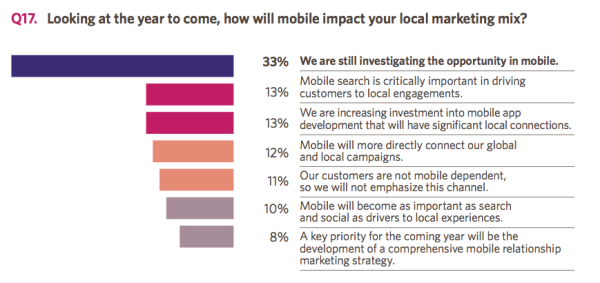
While many brands and retailers have a vague understanding of the importance of localizing their marketing efforts, they simply aren’t doing it effectively — if at all.
Read MoreMarketers' Knowledge Of Mobile Email Metrics, August 2012 [CHART]
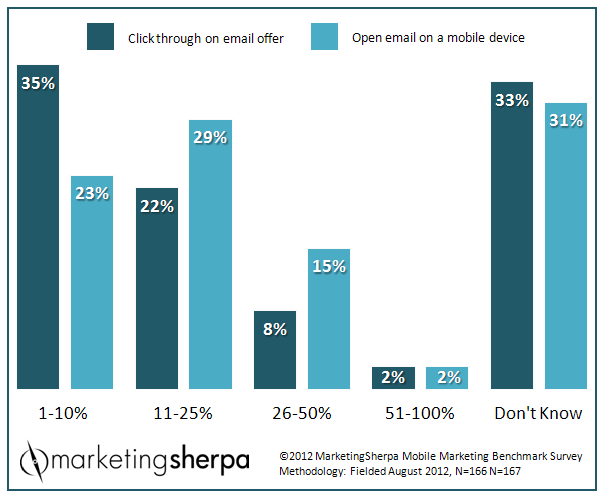
31% of email marketers do not know their mobile email open rate.
Read More