Mobile Marketing
American CPG Mobile Apps, February 2013 [CHART]
More than 80% of CPG employees said their company had at least one mobile app in use in February 2013, and nearly three-quarters had two or more apps.
Read MoreLikely Cable To Streaming Video Subscription Switchers [TABLE]
12% strongly agreed with the statement: I would consider replacing my cable subscription with a streaming media subscription (e.g., Netflix, Hulu Plus) in 2013.
Read MoreDigital TV & Movie Viewers, 2012-2017 [CHART]

The number of US digital TV viewers will reach 145.3 million in 2017, up from 106.2 million in 2012.
Read MoreApple Free vs Paid App Revenues, February 2013 [CHART]
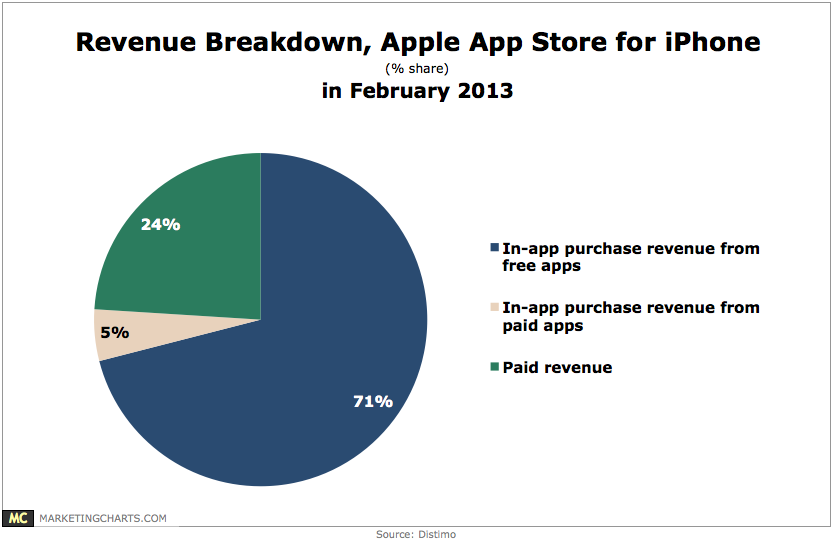
In-app purchases accounted for a new high of 76% of revenue in the Apple App Store for iPhone in February 2013, up from 53% in January of last year.
Read MoreGrowth Of Mobile Real-Time Bidding Ads, Q1-Q4 2012 [CHART]
While less than 10% of mobile ads served were purchased via RTBs in Q1 2012, that share climbed to nearly two-thirds in Q4.
Read MoreGlobal Mobile Ad Spending Share By Vertical, Q4 2012 [CHART]
The worst performers on tablets vs. smart phones were the fast-moving consumer goods and retail industry, along with the social and dating category.
Read MoreTablet Ad Click-Through Rate Uplift By Industry, December 2012 [CHART]
Click-through rates for entertainment and media, as well as the travel category rose by 81% and 66%, respectively.
Read MoreSmart Phone Use To Begin The Day, March 2013 [CHART]
89% of 18-24-year-old smart phone owners reach for their device within 15 minutes of waking up, and 74% reach for it immediately after waking up.
Read MoreWhere People Consume Text & Video Content, March 2013 [CHART]
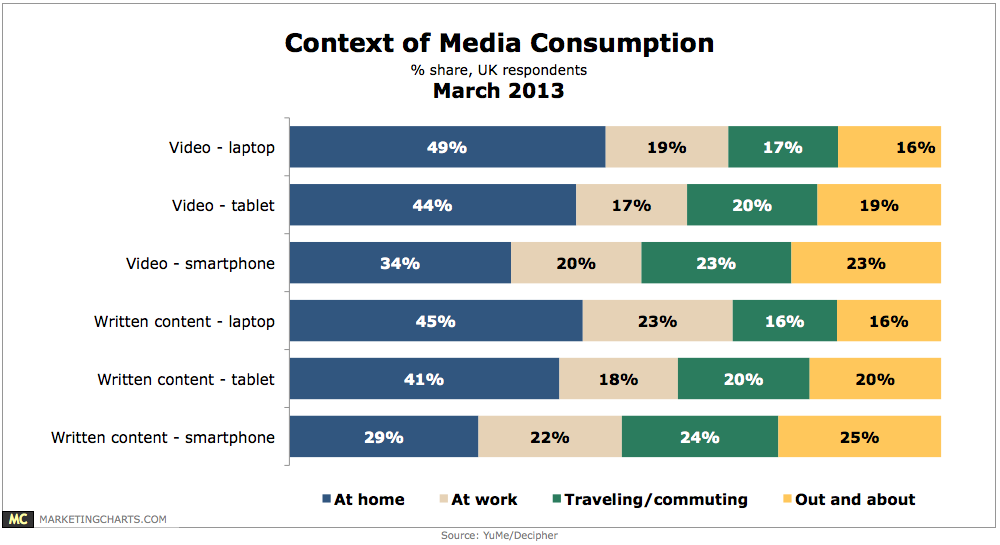
Regardless of device, consumption of videos takes place most often in the home and users are both more relaxed and explorative while at home.
Read MoreLocal Business Searches Resulting In Purchase By Device, March 2013 [CHART]
Almost 86 million people use their mobile phones to seek local business information in the US.
Read More