Mobile Marketing
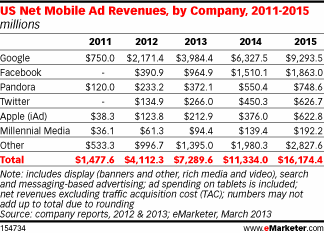
US Net Mobile Ad Revenues By Channel, 2011-2015
eMarketer revised its estimate for 2012 spending only slightly upward from the previous forecast in December 2012.
Read MoreUS Mobile Ad Spending, 2011-2017 [CHART]
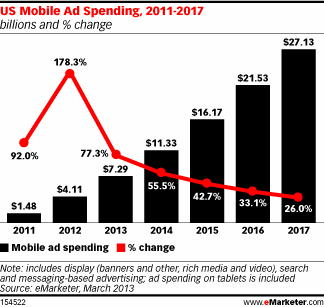
US mobile advertising spending grew 178% last year to $4.11 billion.
Read More
Mobile Search Behavior By Daypart [INFOGRAPHIC]
77 percent of mobile searches taking place during the study period took place at home or at work.
Read MoreB2B Marketing Budgets [INFOGRAPHIC]
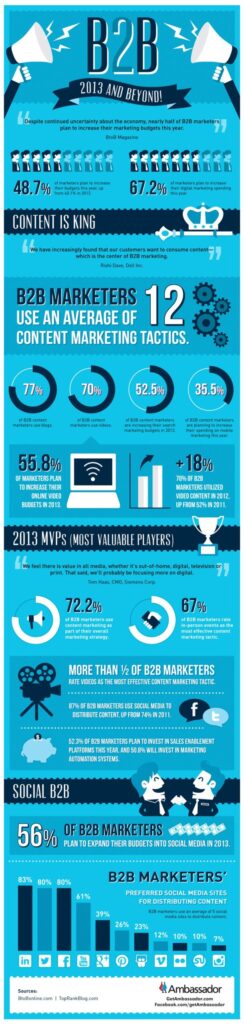
This infographic by Ambassador illustrates how B2B marketers are spending in 2013.
Read MoreAmericans' Daily Media Consumption, 2012 vs 2013 [CHART]
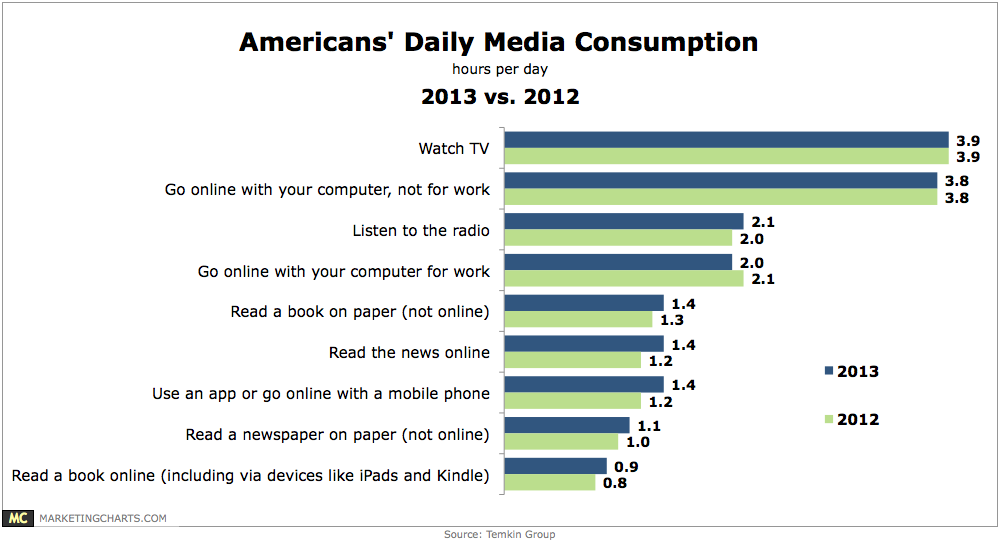
Americans are holding steady in terms of their TV consumption and non-work-related internet use, but are spending more time with other activities such as reading books and accessing the internet via a mobile device.
Read MoreMobile Device Use By Activity & Device Size, February 2013 [CHART]
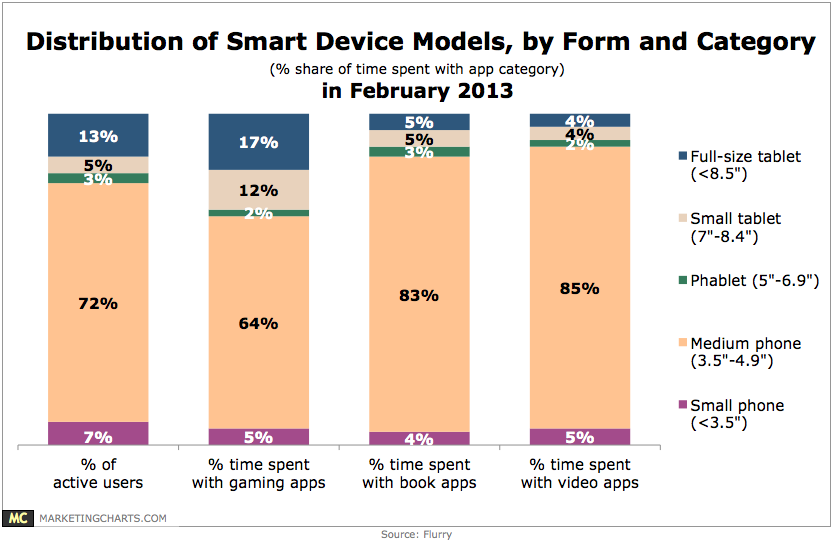
While small (5%) and full-size (13%) tablets accounted for less than 20% of active smart device users around the world, they represented 29% of time spent playing gaming applications on such devices in February 2013.
Read More
Beyond Social Media: Macy's $1,453 Typo; Yelp Reviews; Prankvertising; Kevin Ware & Social Empathy [PODCAST]

This week: Macy’s $1,453 Typo; Yelp’s Filtered Reviews; Nike’s Winning Ad Lampooned; Prankvertising; Kevin Ware & Social Empathy; Silent Instagram Film Trailers; Punch Pizza Goes To Naples; HP’s Bouncing Cam; Blogging Rules; Shiny New Stuff & Daily Numbers.
Read MoreMain Reasons CPG Companies Launch Mobile Apps, February 2013 [CHART]
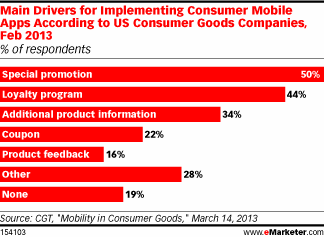
The biggest reason CPG companies reported implementing consumer mobile apps was to drive special promotions, cited by half of respondents.
Read More