Mobile Marketing
Multiscreen Behavior With Facebook & Twitter By Gender, March 2013 [CHART]
Women were slightly more likely than men to turn to social media while watching TV, traveling and exercising, and significantly more likely to do so while shopping.
Read MoreMultiscreen Behavior With Facebook & Twitter, March 2013 [CHART]
More than eight in 10 Facebook users and about two-thirds of Twitter users used social networks while channel surfing.
Read MoreTime Spent On iOS & Android Devices By Activity, April 2013 [CHART]
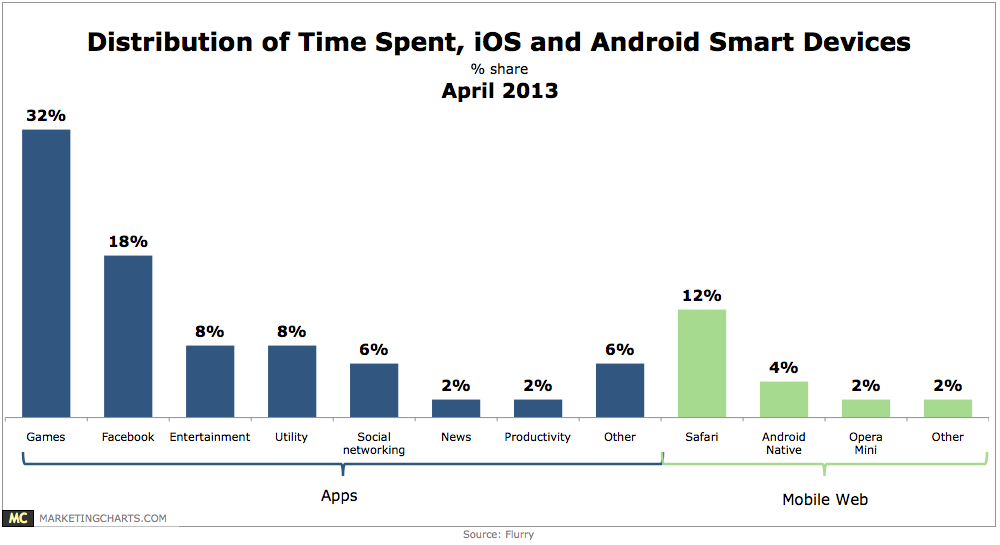
Android and iOS smart phone and tablet users spend an average of 2 hours and 38 minutes per day on their devices.
Read More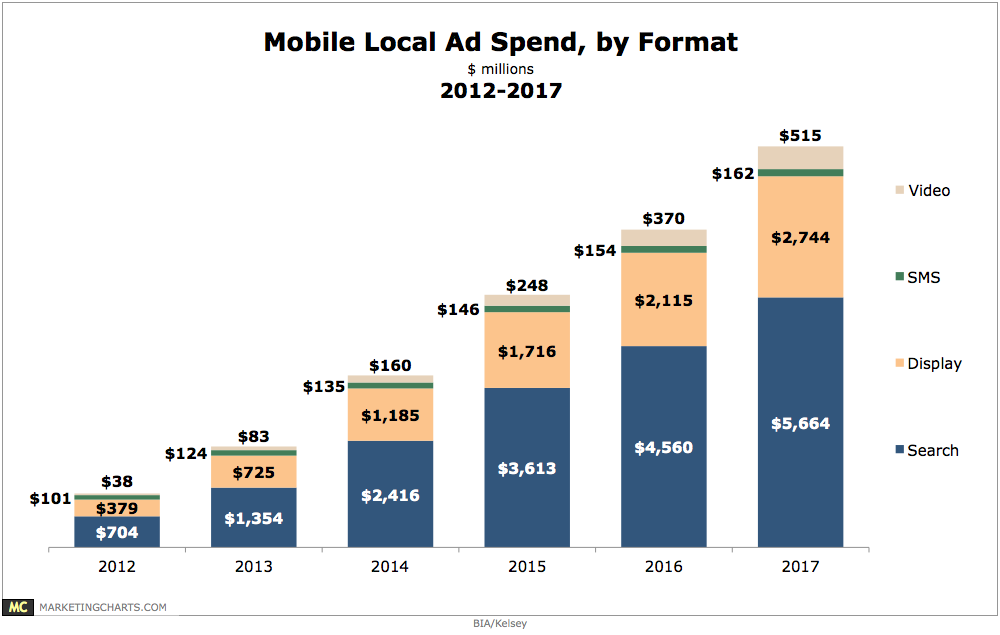
Smart Phone Growth, October 2011 – February 2013 [CHART]
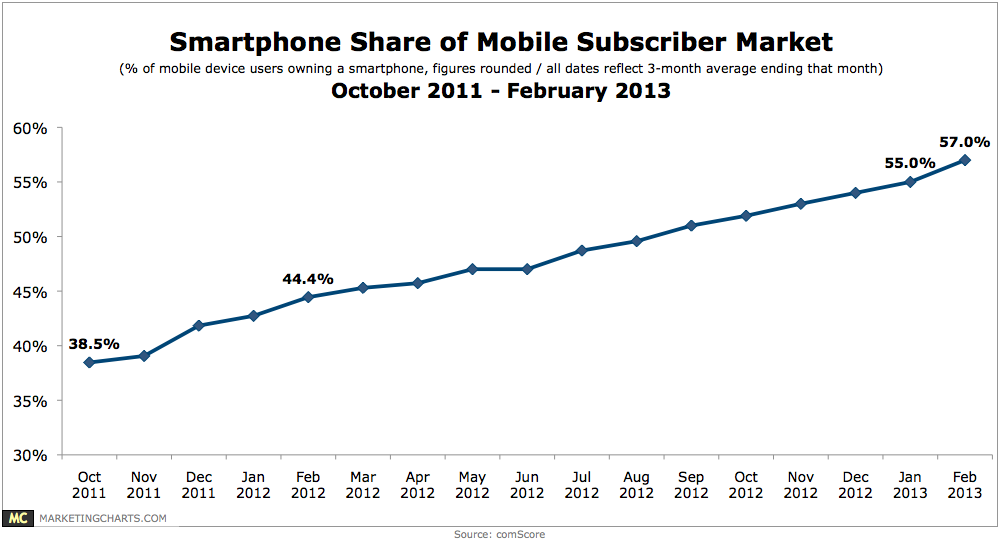
Smart phone penetration climbed to 57% of the US mobile market during the 3-month period ending in February 2013.
Read MoreChannel ROI Ratings, April 2013 [CHART]
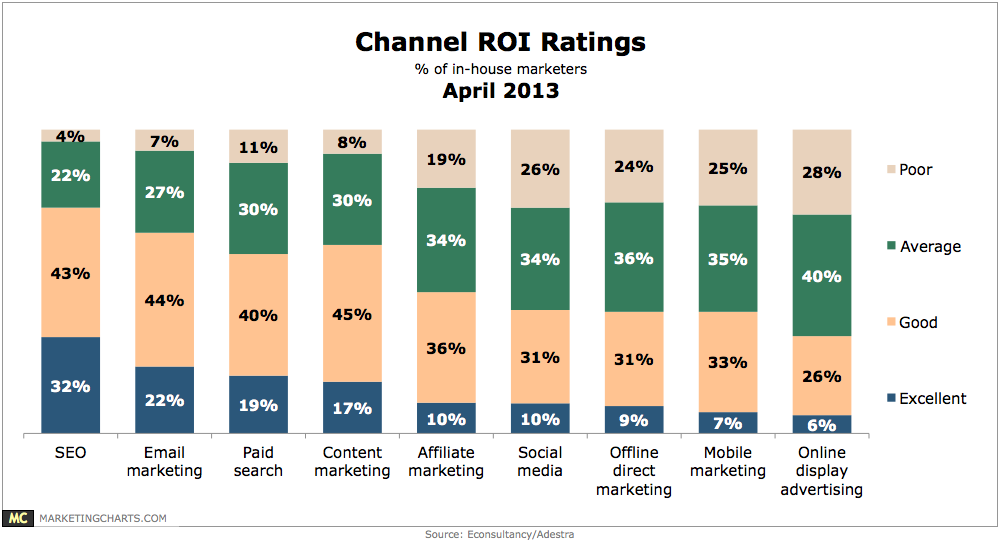
75% of global marketers (primarily from the UK) rate SEO as “excellent” (32%) or “good” (43%) in terms of return on investment.
Read MoreProximity Of Mobile Phones To Their Owners, April 2013 [CHART]
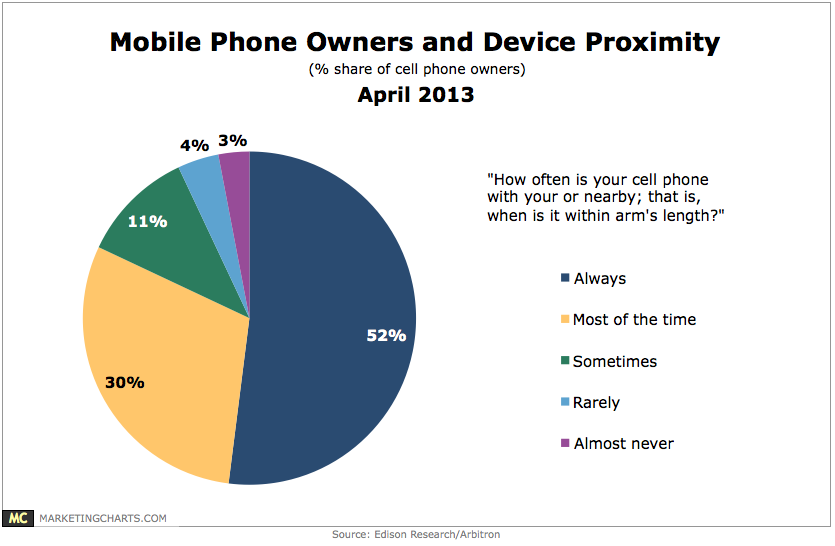
52% of mobile phone owners always keep their device within arm’s reach, and another 30% do so most of the time.
Read MoreOnline Viewership For Broadcast TV, March 2013 [TABLE]
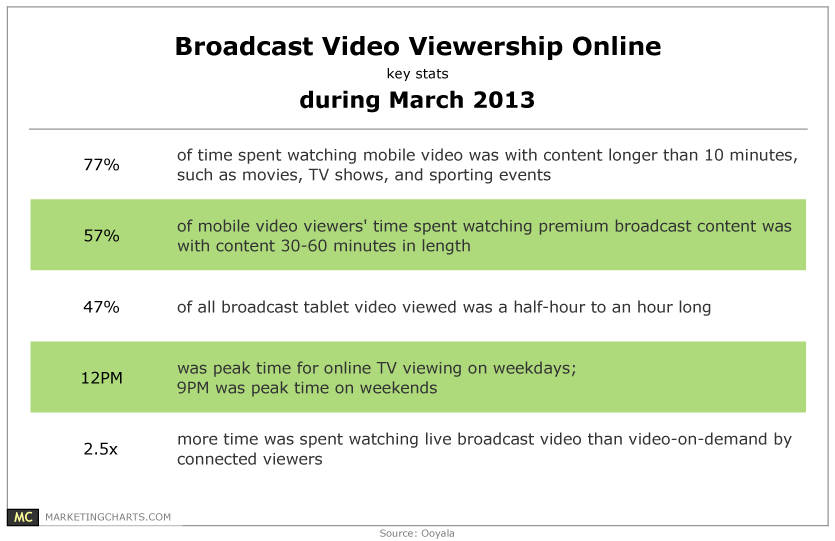
Connected viewers watched live broadcast video 2.5 times longer than video on demand (VOD), while 77% of time spent watching mobile video was with content longer than 10 minutes, such as movies, sporting events, and TV shows.
Read MoreMobile Local Ad Spending, 2012-2017 [CHART]
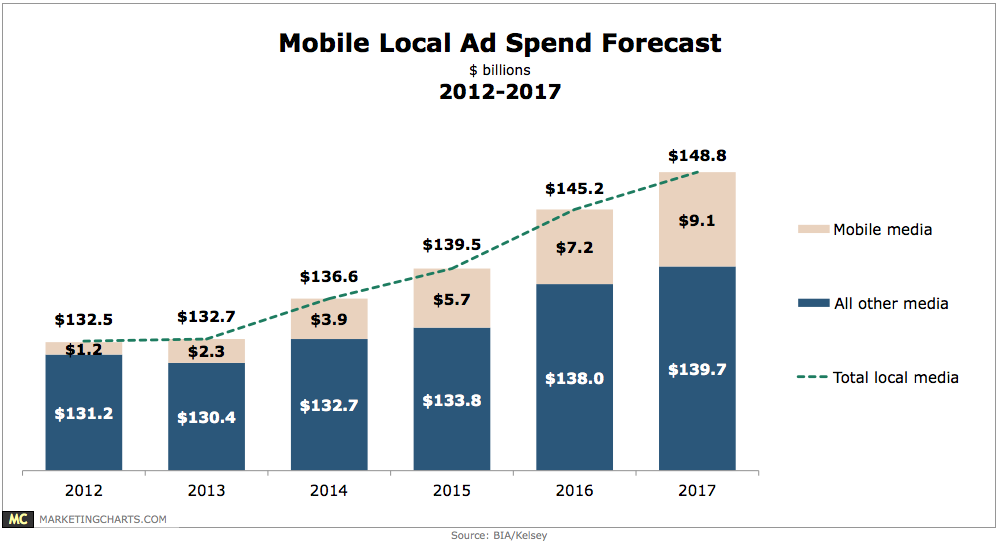
Increasing smart phone penetration and concurrent increases in ad inventory should spur 49.3% annual growth in local mobile ad spending through 2017.
Read MoreUS Net Mobile Display Ad Revenue Share By Company, 2011-2015 [TABLE]
Facebook, the No. 2 mobile ad publisher in the country, accounted for 9.5% of mobile ad revenues in 2012 and is expected to take 13.2% this year.
Read More