Mobile Marketing
Mobile Ad Traffic By Device, Q4 2012 vs Q1 2013 [TABLE]

Among mobile platforms, Apple’s iOS leads in monetization performance on the Opera Advertising mobile platform.
Read MoreUS Desktop vs Mobile Social Media Ad Spending, 2012-2017 [TABLE]
Mobile-social spend is expected to rise by a CAGR of 30% over the forecast period.
Read MoreTop Online Ad Formats By Share Of Revenue, 2011 vs 2012 [CHART]
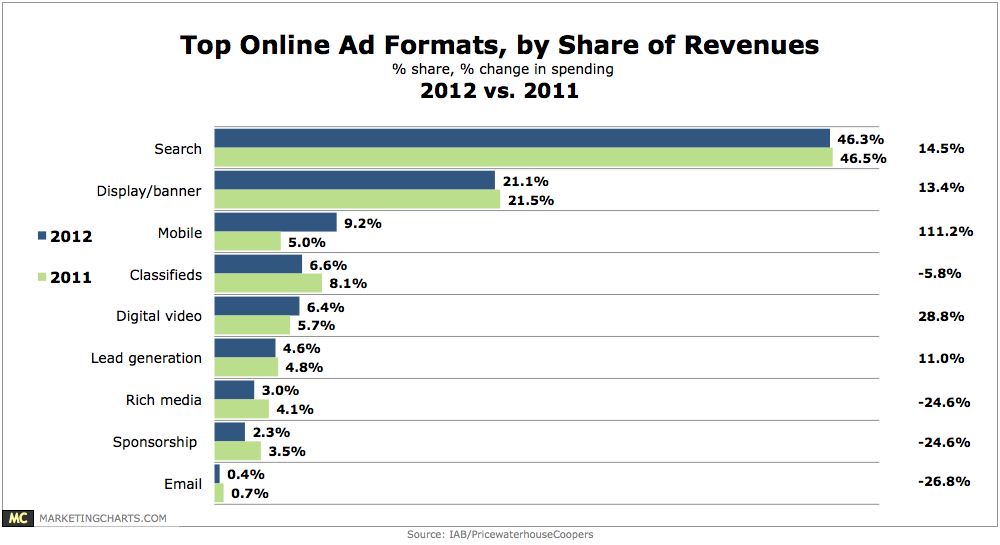
Online ad revenues grew by 15% year-over-year in 2012.
Read MoreGlobal mCommerce Interest By Gender, April 2013 [CHART]

Men appear to be more interested in using their mobile phones than women.
Read MoreConsumers & Cross-Channel Retail, April 2013 [TABLE]
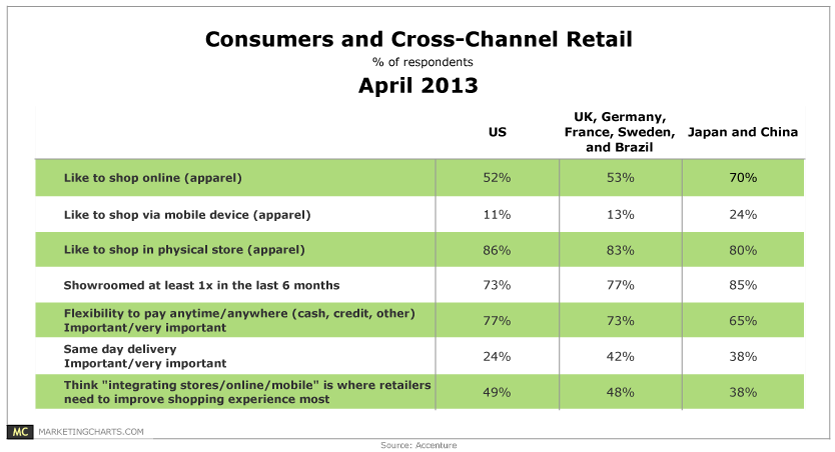
49% of US consumers believe the best thing that retailers can do to improve the shopping experience is to better integrate in-store, online and mobile shopping channels.
Read MoreDaily Search Marketing Tactics, Q3 2012 [CHART]
The rising tide of mobile queries brought several search engine optimization (SEO) matters to a head in 2012.
Read MoreUS Local Mobile vs Desktop Search Volume, 2011-2016 [CHART]
Google estimated that 20% of searches across all platforms worldwide have local intent.
Read More
US Mobile Search Ad Spending, 2011-2017 [CHART]

Desktop search volume declined for the first time, while the share of queries from smart phones and tablets reached roughly 20%.
Read MoreOnline Ad Price Trends By Ad Type, January vs March 2013 [CHART]
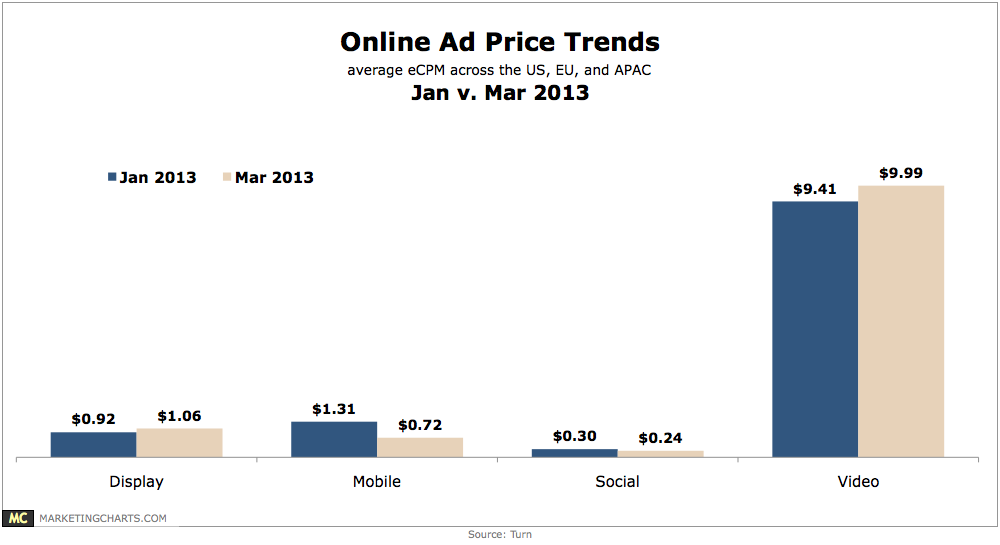
Average video eCPMs increased 6.2% between January and March 2013, from $9.41 to $9.99, while display ad prices grew by 15.2% from $0.92 to $1.06.
Read More