Mobile Marketing
Branded Vines More Likely To Be Shared Than Branded Videos [VINE]
According to a survey conducted by Unruly, branded Vines are four times more likely to be shared than branded videos and five Vine tweets are sent every second.
Read MoreUS TV & Digital Video Ad Spending Growth By Type, 2012-2017 [TABLE]
Growth rates for mobile video ad spending will be far greater than for any other related channel—television, online or total digital.
Read MoreUS Mobile Video Ad Spending, 2012-2017 [CHART]
The number of smart phone video viewers in 2014 is expected to hit nearly 87 million, or more than one-quarter of the total US population.
Read MoreSecurity Measures Not Taken By Smart Phone Owners, May 2013 [TABLE]
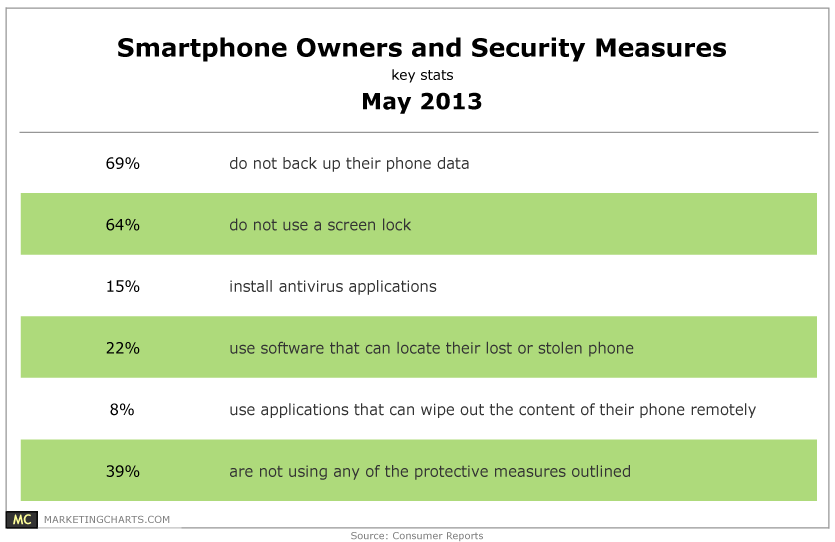
Only 22% of smart phone users have installed an application to locate a missing phone.
Read MoreFinancial Pros' Use Of Social Tools For Business & Pleasure, Q1 2013 [TABLE]
One-third of respondents said they used LinkedIn only for business purposes, compared with 2% of Facebook users and 3% of respondents on Twitter.
Read MoreRadio Listeners' Social Media Use, May 2013 [CHART]
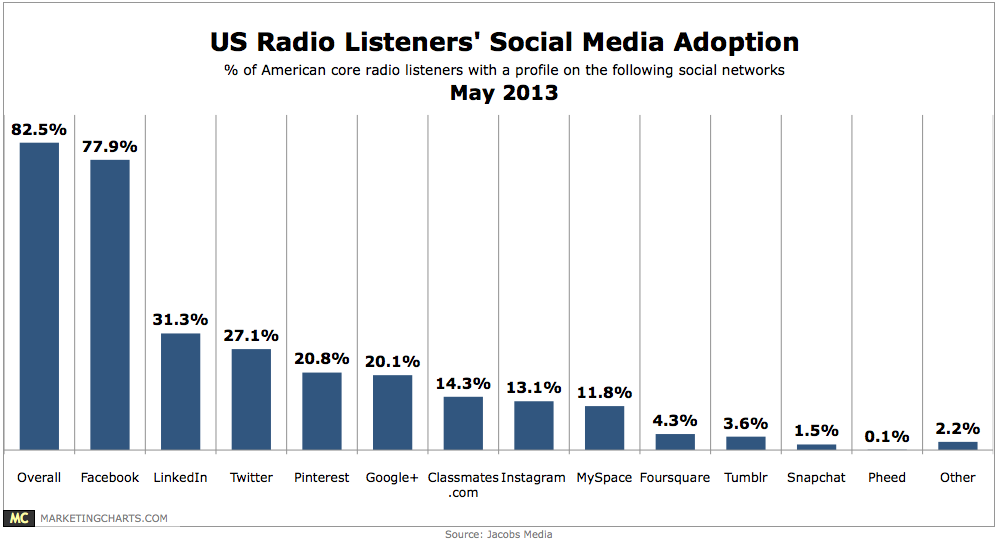
83% of radio listeners in the US have a profile on a social networking site.
Read MoreMobile Devices & Local Content, May 2013 [TABLE]
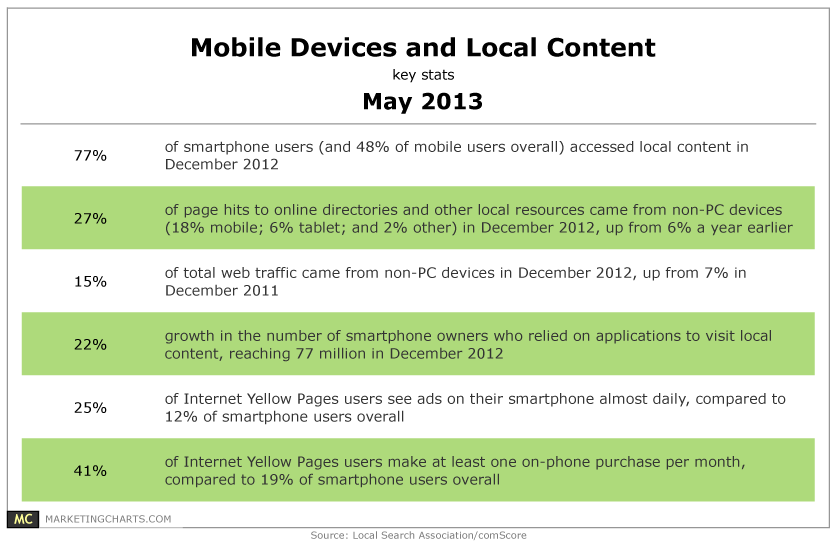
48% of mobile phone users accessed local content in December 2012, up from 42% a year earlier.
Read MoreSmart Phone Penetration, October 2011 – March 2013 [CHART]
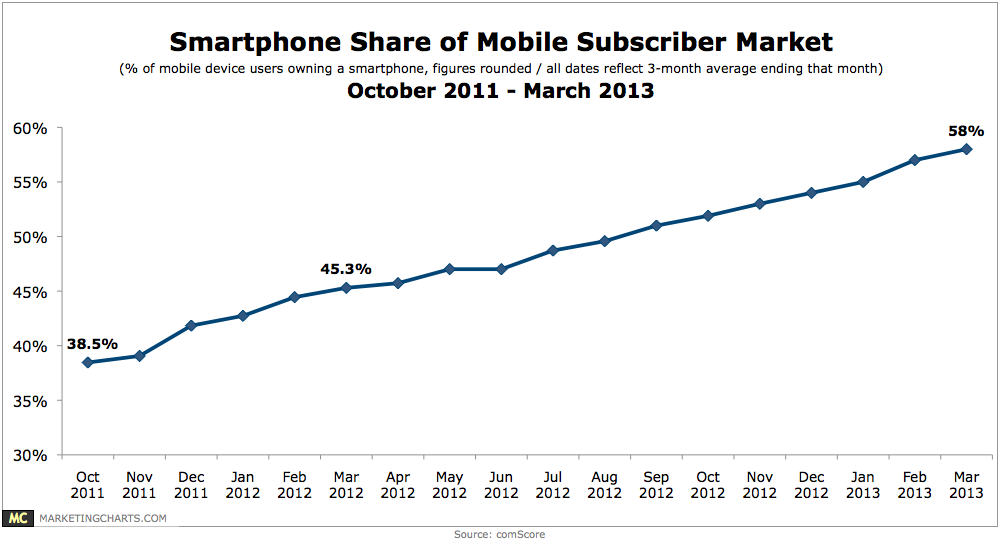
During the 3-month period ending in March, smart phone penetration reached 58% of the mobile market, up a percentage point from the prior month and almost 30% year-over-year.
Read MoreAmerican Text Messaging Volume, 2008-2013 [CHART]
Texting is the most common activity on a mobile phone after talking, accounting for roughly 1 in every 7 minutes spent on a mobile phone.
Read MoreDemographics Of Online Video Viewers By Video Type, May 2013 [TABLE]
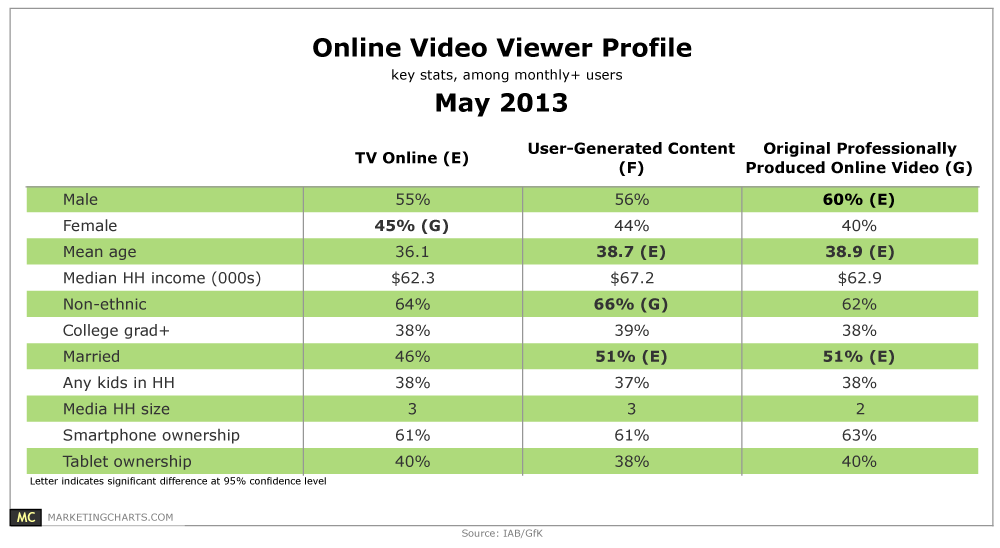
1 in 5 or more American adults watch a TV show online (23%), user-generated content (UGC – 31%), or originally produced online video (OPOV – 19%) on at least a monthly basis.
Read More