Mobile Marketing
Mobile Connected Device Mix, Q1 2012 – Q1 2013 [CHART]
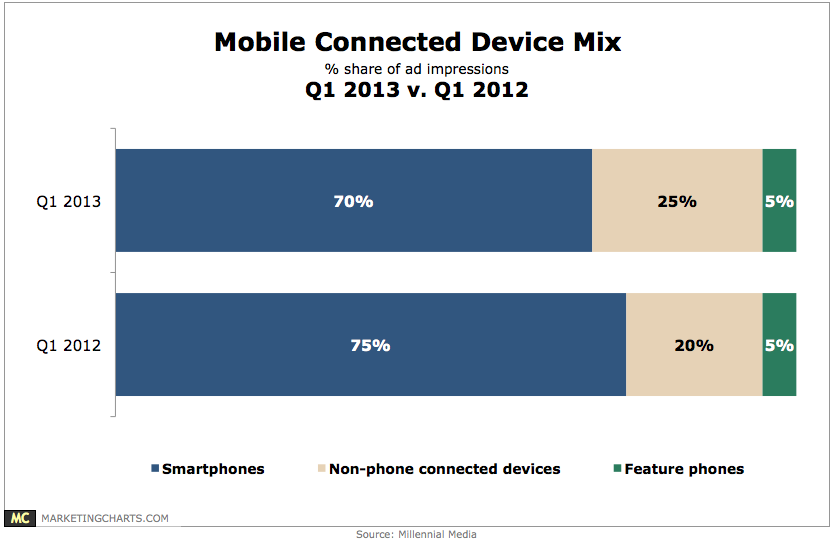
Non-phone connected devices accounted for 25% of total platform impressions, up from 20% a year earlier.
Read MoreFrequency With Which SMB Employees Check Work Email After Hours, May 2013 [CHART]
Email is still very much an ingrained activity among SMB employees, to the extent that 74% check work email outside of standard work hours, with most of those doing so at least several times a day.
Read MoreGoogle Glass & Attention Data

With Google Glass, Google may be creating a whole new set of data that has never existed before: Attention Data.
Read MoreShopping Apps People Download, April 2013 [CHART]
Just more than one-third of respondents said they had downloaded an app specific to a particular store.
Read MoremCommerce Customers, April 2013 [CHART]
55% of respondents had ever made a purchase on their mobile device, although only 9% did so with great frequency.
Read MoreExperience With New Online Marketing Tactics, December 2012 [CHART]

Nearly 70% of respondents described their experience level with responsive design as average or better.
Read MoreSmart Device Users Worldwide By OS & Form Factor, February 2013 [CHART]
The vast majority of Android and iOS devices in use on the Flurry platform—and all Window devices—were medium phones.
Read MoreAd Click-Through Rate By Format, 2012 [CHART]
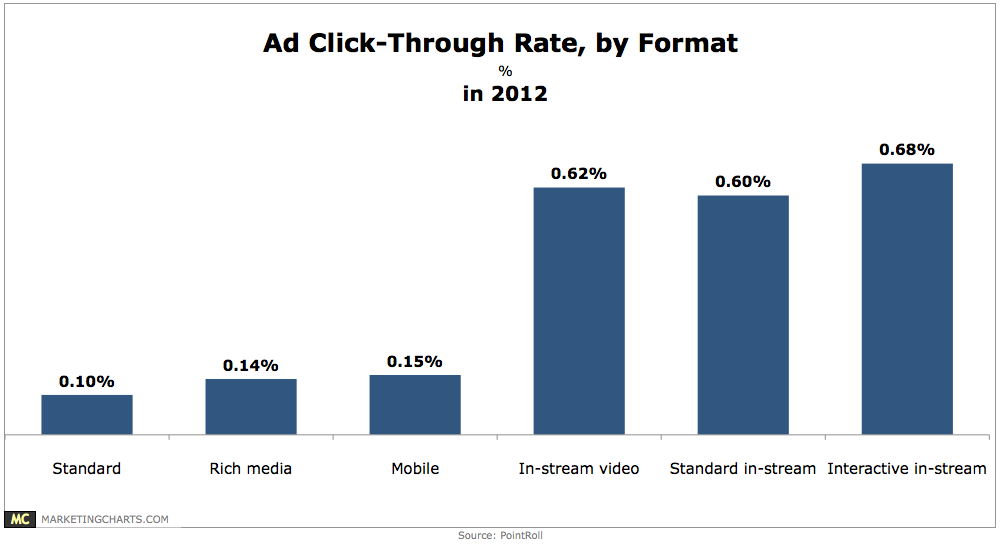
In-stream video ads achieved an average click-through rate (CTR) of 0.62% last year, far outpacing mobile (0.15%), rich media (0.14%) and standard banner (0.1%) ads.
Read MoreDigital Channels By Ability To Drive Store Traffic & Sales, May 2013 [CHART]
Nearly all retailers see their e-commerce sites as having a lot (58%) or some (38%) value in driving traffic to stores.
Read MoreBeyond Social Media: Nutella & Skittles Go Nuts [PODCAST]

This week: Nutella & Skittles go nuts, Hanes gets all destructive, Verizon demonstrates its services by partnering with a bear.
Read More