Mobile Marketing
Share of eCommerce Traffic From Smart Devices, Q1 2012 – Q1 2013 [CHART]
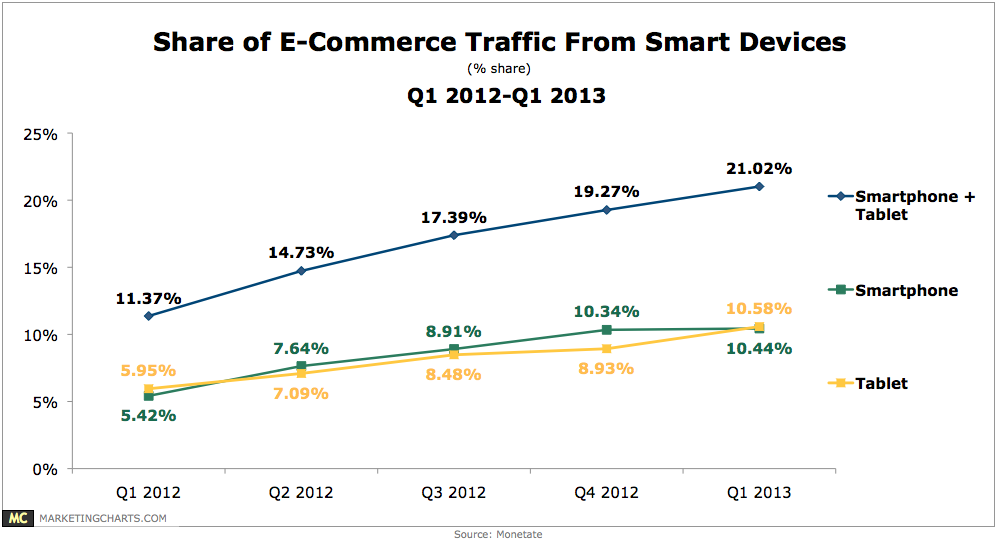
Tablets accounted for 10.6% of e-commerce site traffic in Q1, up from 8.9% a quarter earlier, while smartphones also exceeded 10% of traffic (10.44%), though with only slight growth from the previous quarter.
Read MoreMobile Video Discovery Methods, May 2013 [CHART]
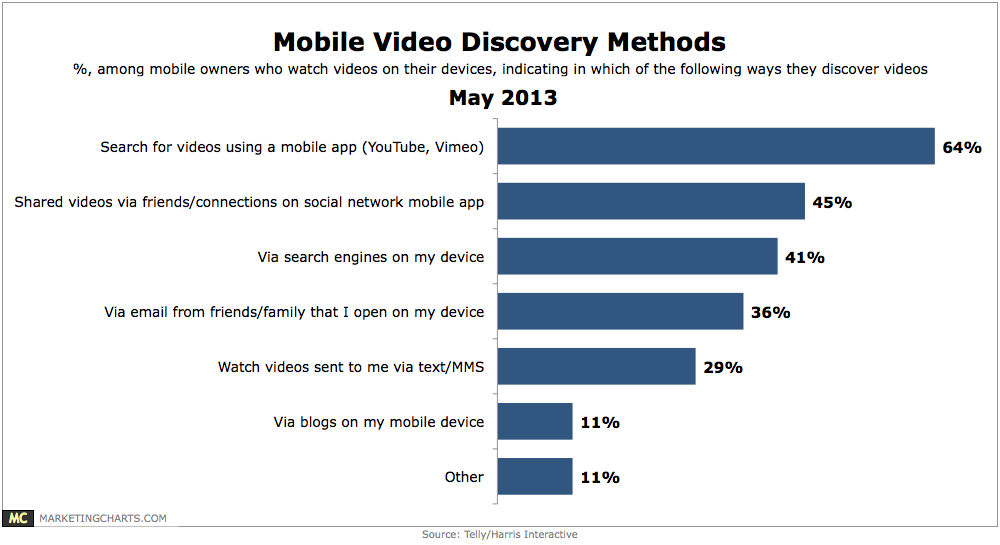
35% of mobile device owners watch videos on their device.
Read MoreCross-Device Travel Research & Purchase Behavior, May 2013 [CHART]
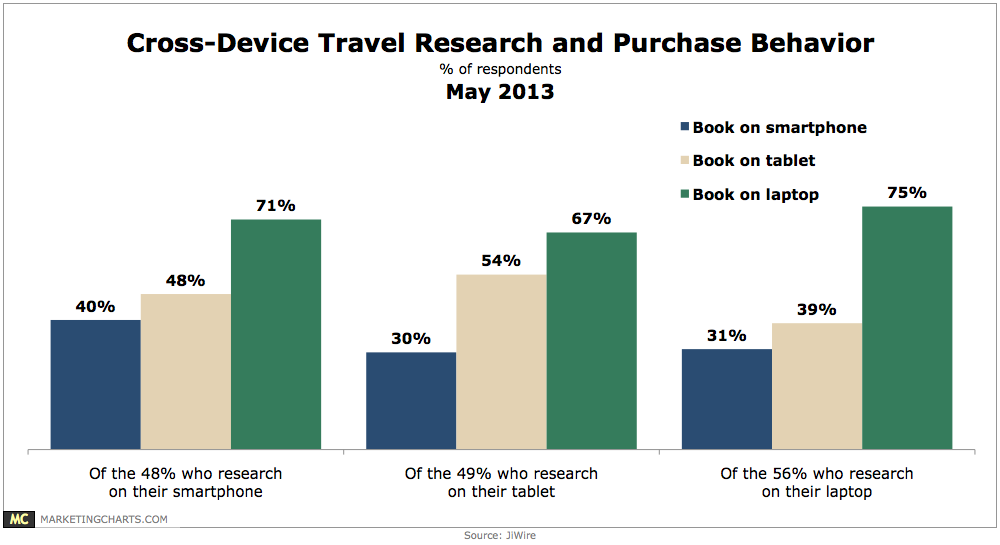
Among mobile owners who booked travel in the past 90 days, only 53% used a single device (smart phone, tablet, or laptop) to do so.
Read MoreUS Mobile Phone Gamers, 2011-2017 [TABLE]
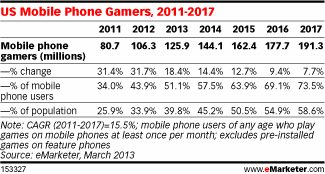
Double-digit mobile gaming growth rates will continue into 2015, when half of all US residents are expected to play games via their mobile phone at least once per month.
Read MoreUS Mobile Gaming Revenue Share By Type, 2011-2017 [CHART]
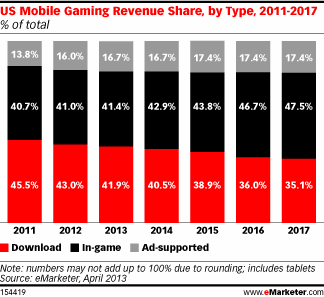
This year, the largest share of revenues will come from downloads of games themselves, with in-game purchases accounting for just slightly less.
Read MoreUS Mobile Gaming Revenues By Type, 2011-2017 [TABLE]
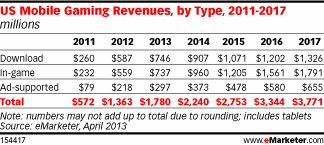
Mobile gaming has been a high-growth market in recent years, with revenues increasing at triple-digit rates in 2012 and 2011.
Read MoreChanges In Digital Marketing Spending By Category, March 2013 [CHART]
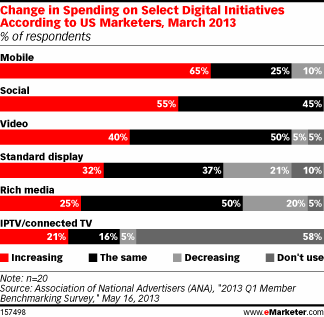
Marketers seem to have no hesitations about social, as 55% of respondents said they were putting more dollars to the format, while no advertisers reported decreasing social investments.
Read MoreWestern Europe Smart Phone Penetration, 2012-2014 [MAP]
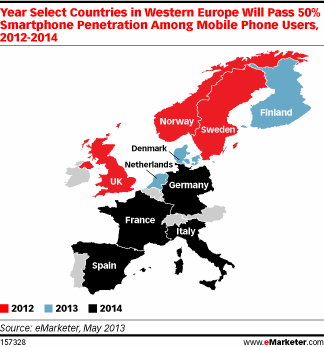
Western Europe as a whole will reach 50% smart phone market penetration in 2014.
Read MoreAsia-Pacific Smart Phone Penetration, 2012 & 2014 [MAP]
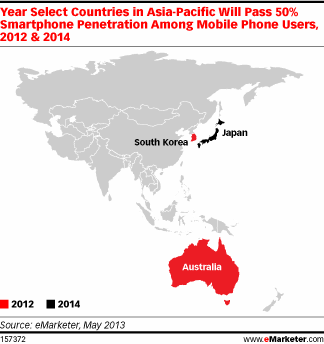
South Korea led the world last year in the share of mobile users who used a smartphone, at 60%.
Read MoreNorth American Smart Phone Penetration [CHART]
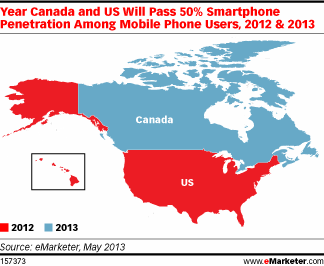
The worldwide smart phone penetration is expected to remain just under one-third in 2013 and will approach the halfway point by 2017.
Read More