Mobile Marketing
Global Mobile Ad Revenues By Company, 2011-2013 [TABLE]
eMarketer estimates that Google made $4.61 billion in mobile internet ad revenues last year, more than triple its earnings in 2011.
Read MoreSmart Phone Ownership By Income & Age, June 2013 [CHART]
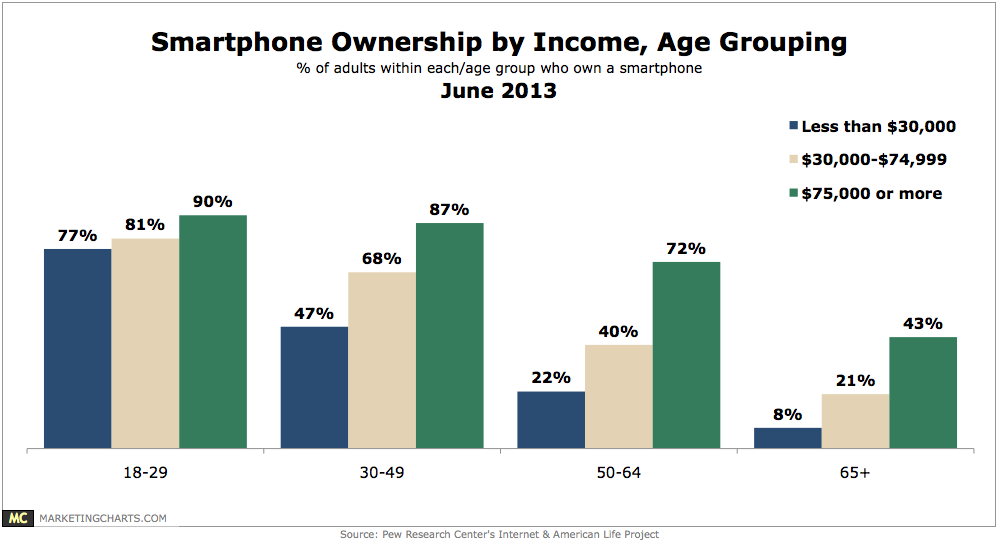
61% of American cell phone owners can be classified as smart phone owners.
Read MoreGlobal Mobile Payment Transactions By Device, June 2012 vs April 2013 [CHART]
Europe sports the world’s largest percentage of transactions made using a mobile device, at 15.3%, followed by Asia (12.4%) and North America (11.2%).
Read MoreShowroomers' Response To Permanent Price Matching, June 2013 [CHART]
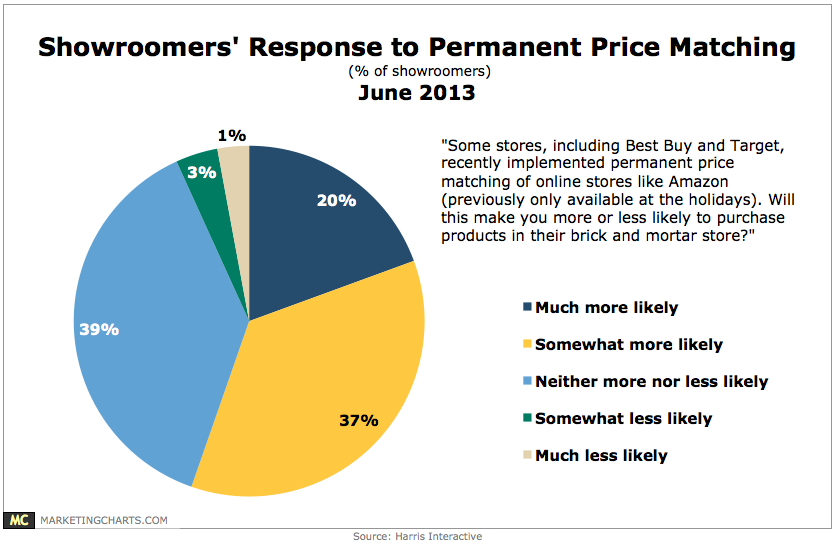
40% of American adults claim to have checked out a product in a brick-and-mortar store before purchasing it elsewhere online.
Read MoreUS Vehicle Shoppers Who Have Visited An Auto Website On Smart Phone, 2010-2012 [CHART]
The percentage of in-market shoppers who visited an automotive website from their smart phone increased from 17% in 2010 to 31% in 2012.
Read MoreDemographics Of US Android & iPhone Owners, May 2013 [TABLE]
Android phones had a 12 percentage point lead over iPhones, with 43% of mobile phone owners between 18 to 24 years old on Android smartphones, compared with 31% on the iPhone.
Read MoreUS Smart Phone Owners By OS, May 2013 [CHART]
In May 2013, Android was ahead of iOS by 3 percentage points; Android ran on 28% of mobile phone owners’ smart phones, compared with 25% on iPhones running iOS.
Read MoreUS Google Net Ad Revenues, 2011-2015 [TABLE]
Mobile’s rapid expansion will help that channel rival the desktop in both search and display revenues for Google by 2015.
Read MoreUS Twitter Net Ad Revenues, 2011-2015 [CHART]
As of 2012, eMarketer estimates, 52% of Twitter’s net US ad revenues were from mobile; by 2015, the share will approach two-thirds.
Read MoreUS Facebook Net Ad Revenues, 2011-2015 [CHART]
eMarketer estimates that after less than a full year selling mobile ads, 18% of US net Facebook ad revenues came from mobile in 2012.
Read More