Mobile Marketing
Native Mobile Ad Performance, Q2 2013 [CHART]
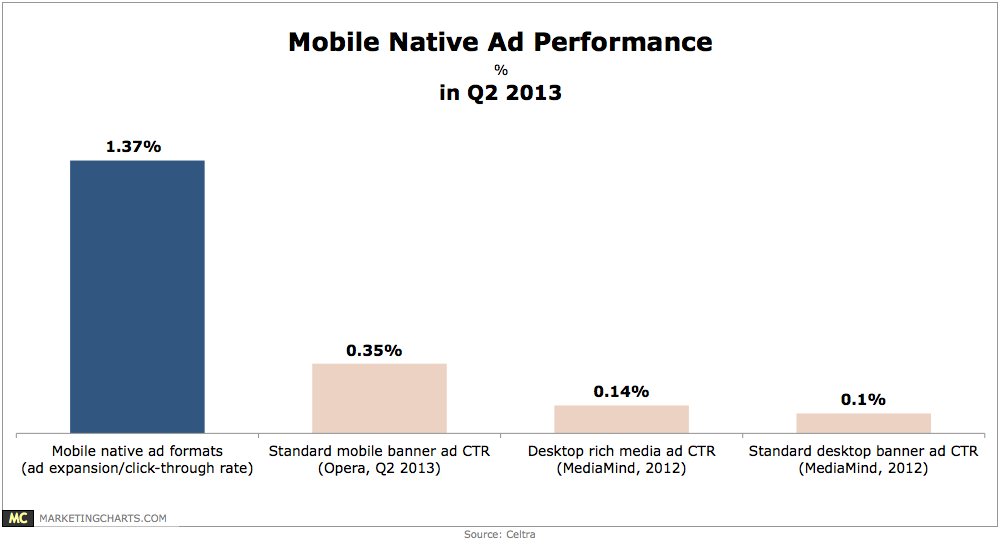
An analysis of mobile expandable banner ad performance indicates that native mobile ad formats delivered an average expansion rate/click-through rate of 1.37% during the second quarter of this year.
Read MoreHow Hospitality Businesses Use Mobile To Engage With Customers, January 2013 [CHART]
More than one-fifth of accommodation businesses worldwide used mobile devices to present customers with special offers.
Read MoreHotels' Mobile App Features, April 2013 [TABLE]
Making reservations was the most common feature on existing mobile apps employed by hotels, used by 72%.
Read MoreDigital Tech Used By Hotels, 2012 & 2013 [TABLE]
Hotels’ use of many digital technologies increased between 2012 and 2013.
Read MoreUS mCommerce Sales By Quarter, Q2 2010-Q2 2013 [CHART]
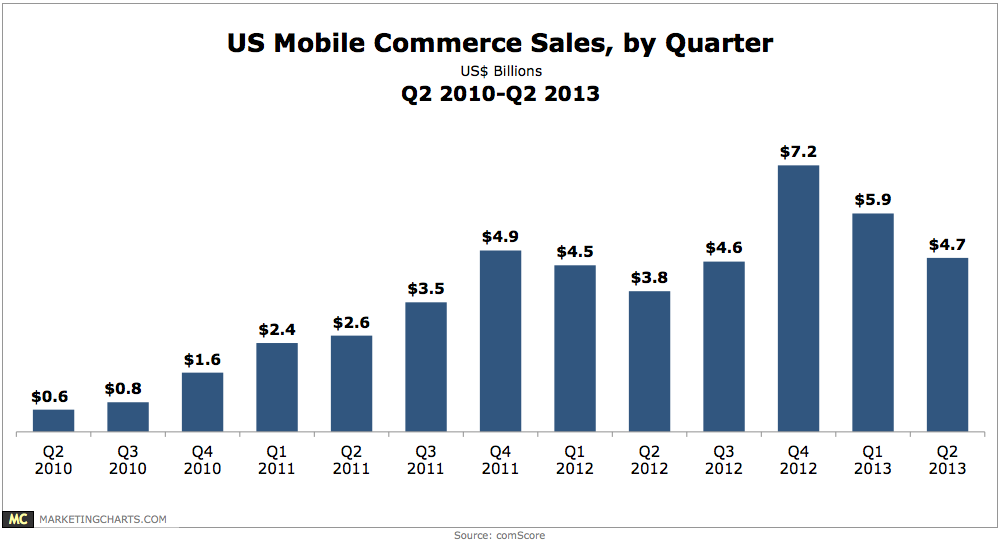
Mobile commerce spending accounted for almost 10% share of total e-commerce sales during the first half of this year.
Read MoreViewership Growth For Digital TV Online & Mobile Video, 2012-2017 [CHART]
There will be 204.6 million US digital video viewers in 2017, representing 78.1% of internet users and 62.7% of the general population.
Read MoreNet Mobile Ad Revenue Share By Company, 2011-2013 [TABLE]
The company is expected to see its share of global mobile internet ad revenues reach 15.8% this year, up from just 5.35% in 2012.
Read MoreLinkedIn Developments Timeline, April 2012 – May 2013 [CHART]
comScore reported that LinkedIn passed Twitter to become the second-largest social network in the world, ranked by unique visitors.
Read MoreHousehold Income Of Feature Phone Users, August 2013 [CHART]
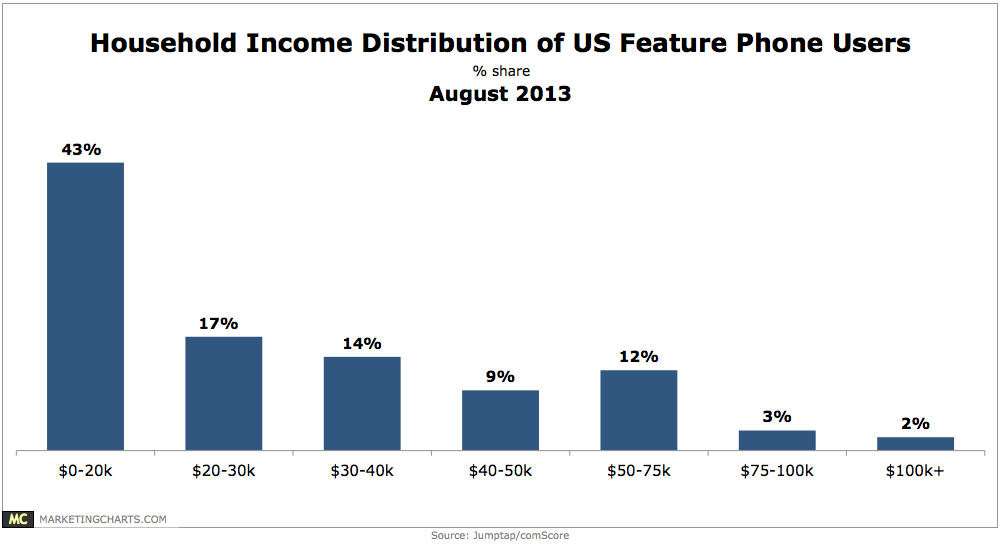
Fully 43% of feature phone owners come from households with annual income levels of $20,000 or less.
Read MoreFeature Phone Users By Age, August 2013 [CHART]
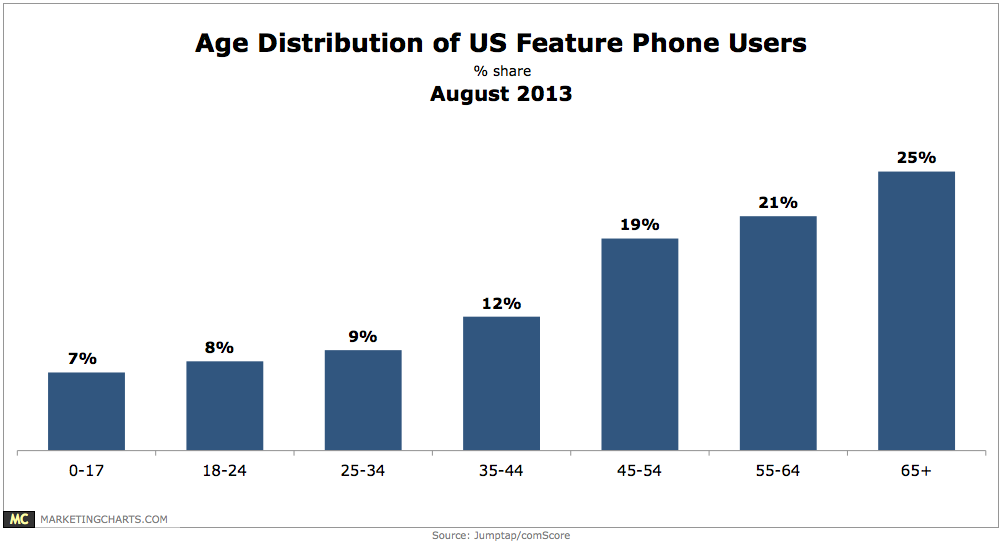
40% of the mobile market hasn’t yet made the switch to smart phones.
Read More