Mobile Marketing
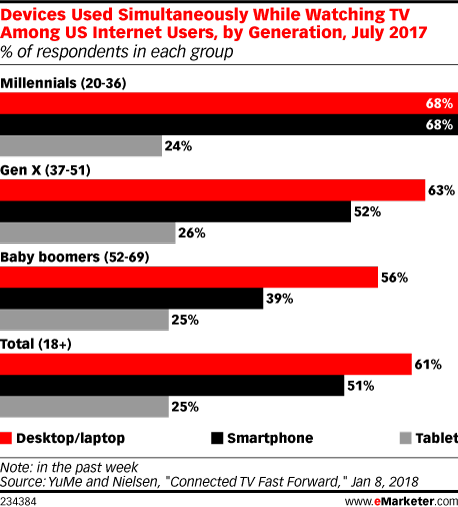
Multitainment Behavior By Baby Boomers, Gen Xers & Millennials [CHART]
Despite TV’s widespread reach, the attention of its US audience is something that’s increasingly fractured across several devices.
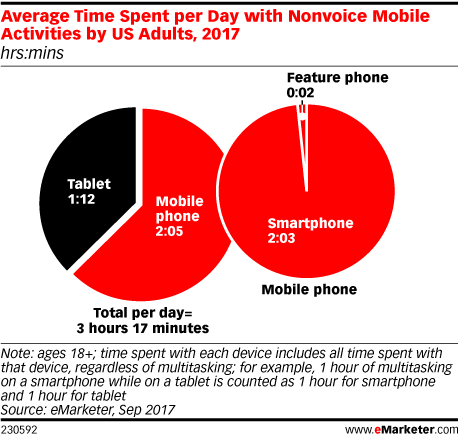
Read MoreAverage Daily Time Spent On Nonvoice Mobile Activities, 2017 [CHART]
Among the media categories for which eMarketer gauges time spent, there aren’t any anticipated to see double-digit increases or decreases next year. (Mobile video comes closest, with an 8.7% rise expected.) Overall, time spent with digital media is expected to grow a modest 3.5%.
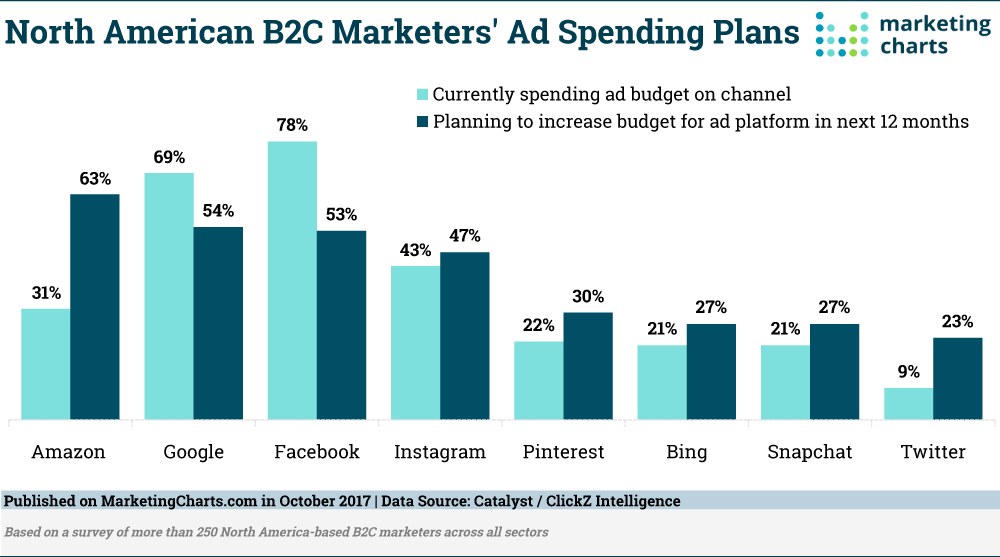
Read MoreB2C Marketers' Ad-Spending Plans [CHART]
Amazon’s US advertising revenue was expected to reach $1.65 billion in 2017 before almost doubling to $3.2 billion by 2019, at which point its ad revenues are expected to be as large as Snapchat and Twitter, combined. New survey results demonstrate that B2C marketers are taking note of Amazon’s potential in the advertising business, and that a sizable share are already advertising with the eCommerce giant.
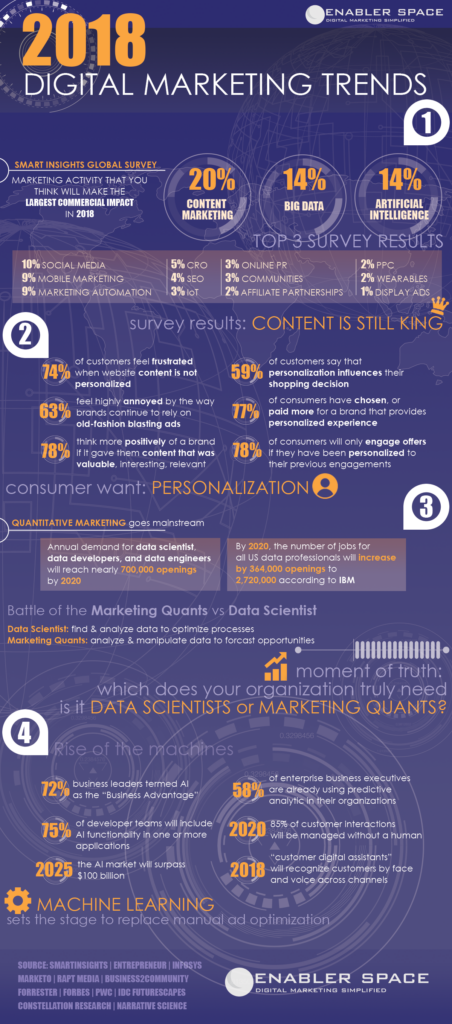
Read More2018 Online Marketing Trends [INFOGRAPIC]
This infographic surveys various online marketing trends for 2018 from a variety of marketing reports. The insights include: 74% of customers feel frustrated when website content is not personalized and many more.
Read MoreMillennials' Likelihood To Participate In Chatbot Commerce [CHART]
Two-thirds of Millennials said they’d be likely to buy an item directly from a chatbot, vs. only 14% who said they would not be interested in doing so.
Read MoreSocial Media Channels As News Sources [TABLE]
A Pew Research Center survey of US social media users found that more are turning to Twitter, YouTube—and even Tumblr—to get news.
Read MoreData Generated Per Minute By Platform [INFOGRAPHIC]
This infographic illustrates just how much data media platforms ranging from Twitter and YouTube to Netflix and Spotify generate by the minute.
Read MoreTV Everywhere Adoption [CHART]
More than one-third (34.7%) of respondents with pay-TV service saying they access their providers’ TV Everywhere offering.
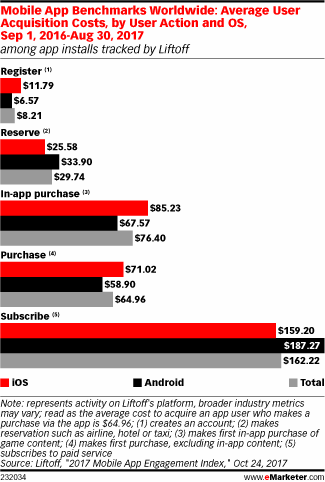
Read MoreGlobal Mobile App Benchmarks [CHART]
Getting a first-time user to install an app isn’t easy. And getting that user to make a purchase within the app is even harder—and a lot costlier. In fact, mobile app marketing and retargeting company Liftoff analyzed user data for a year, and found that the average cost to acquire a user who makes a purchase via an app is $64.96.
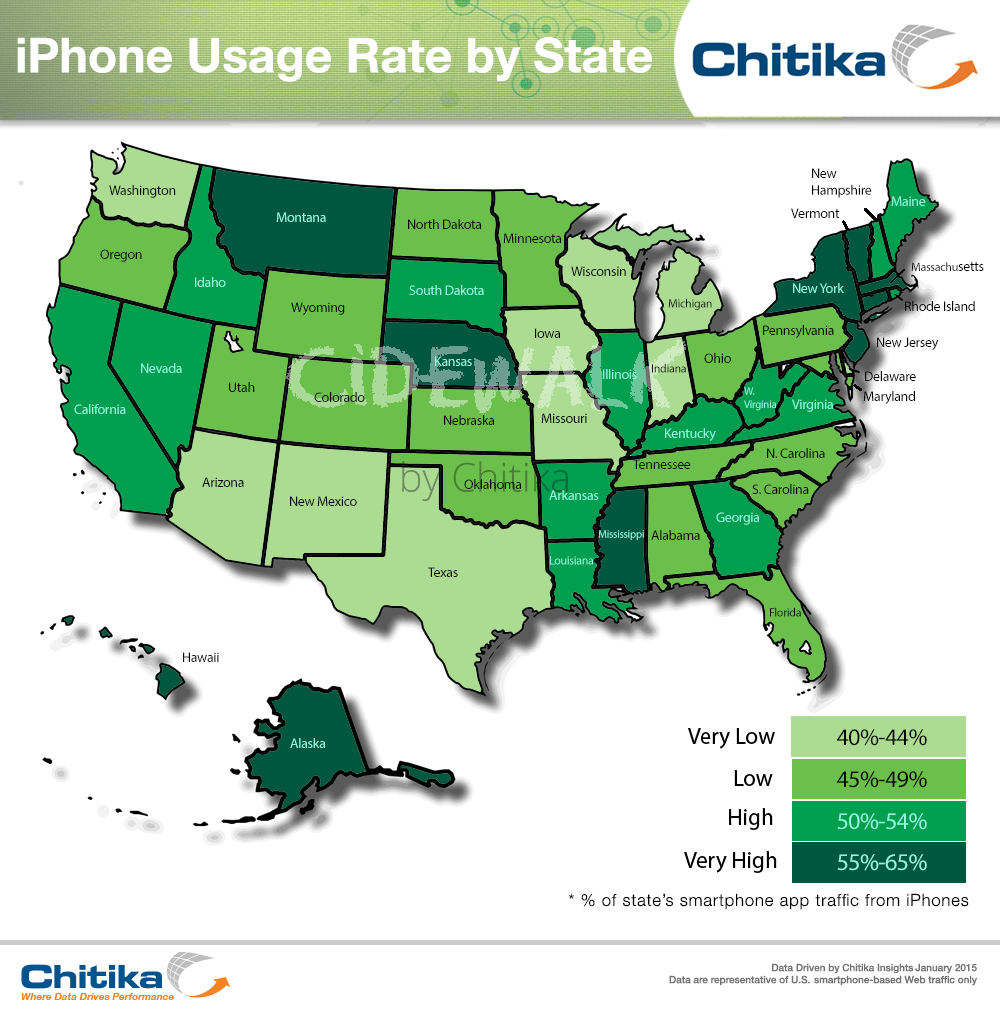
Read MoreiPhone Use Rates By State [MAP]
This infographic illustrates how state-by-state iPhone usage rates correlates with education level and population density. Read more at Chitka.
Read More