Mobile Marketing
What Service Providers Could Do To Prevent Customers From Switching, October 2013 [CHART]
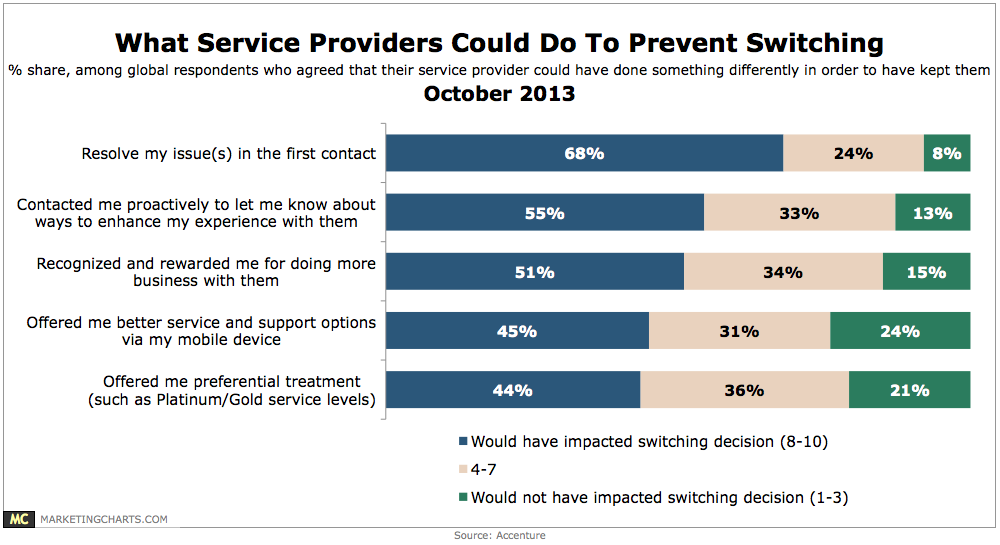
66% of consumers from 32 countries report having switched a service provider (from any 1 of 10 industries measured) during the past year.
Read MorePreferred Customer Channel For Insurance-Related Activities, 2013 [TABLE]
When it came to using insurance products or researching new ones, the highest number of customers preferred to do so online.
Read MorePreferred Social Networks Among American Teens, Fall 2012-Fall 2013 [TABLE]
For the first time, social network users with an average age of 16.2 years old said that Twitter was the “most important” social network to them.
Read MoreInstagram Video Sharing, October 2013 [TABLE]
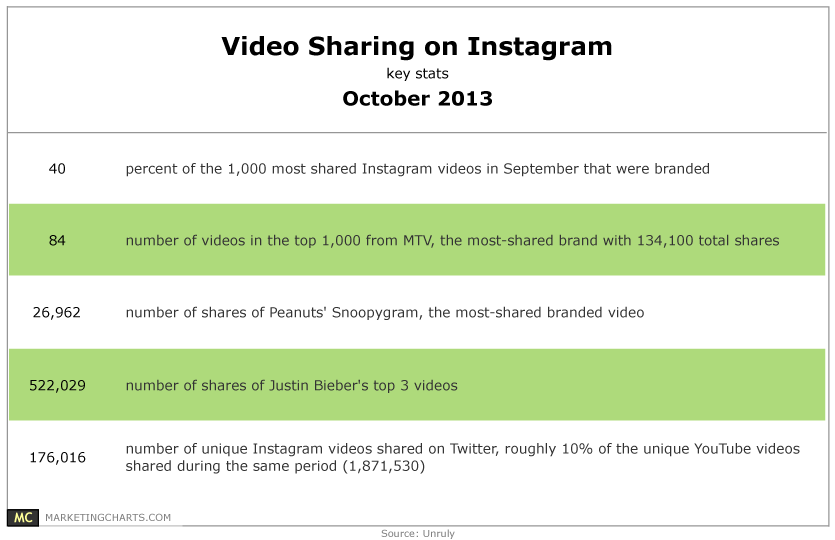
40% of the 1,000 most-shared Instagram videos last month were branded.
Read MoreConversion Rates For Mobile App Promotion Banner Ads By OS & App Category, Q2 2013 [TABLE]
Software apps had the highest conversion rates for banner ads on both Android devices and those running iOS.
Read MoreConversion Rates For Mobile App Promotion Ads By Format & OS, Q2 2013 [CHART]
Interstitials advertising mobile apps garner a conversion rate of just over 3% on devices running Google’s Android operating system.
Read MoreMost Popular Social Networks Among American Teens, October 2013 [CHART]
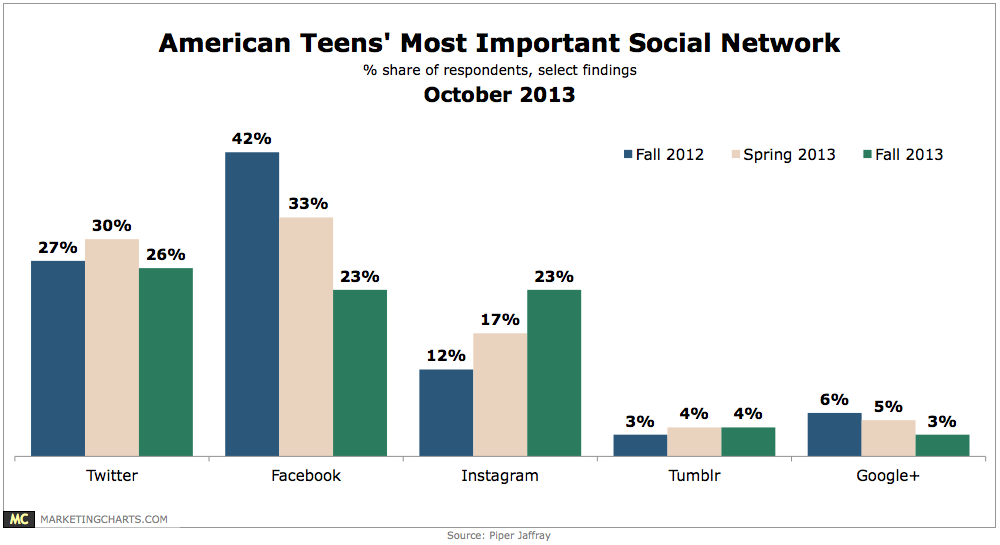
Twitter now ranks ahead of Facebook as teens’ most important social network.
Read MoreBrands Planned Budget Shifts Into Online Video, 2012 vs 2013 [CHART]
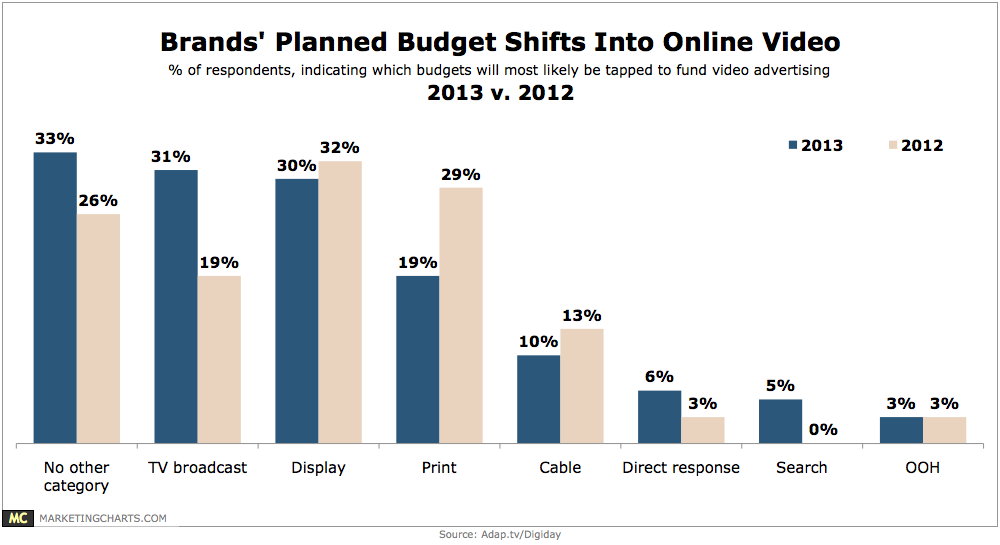
Brands reported an average 65% increase in video ad spending this year over last, with agencies upping their expenditures by 83%.
Read MoreMobile Ad Traffic & Monetization Performance By Device, Q3 2012 vs Q3 2013 [CHART]
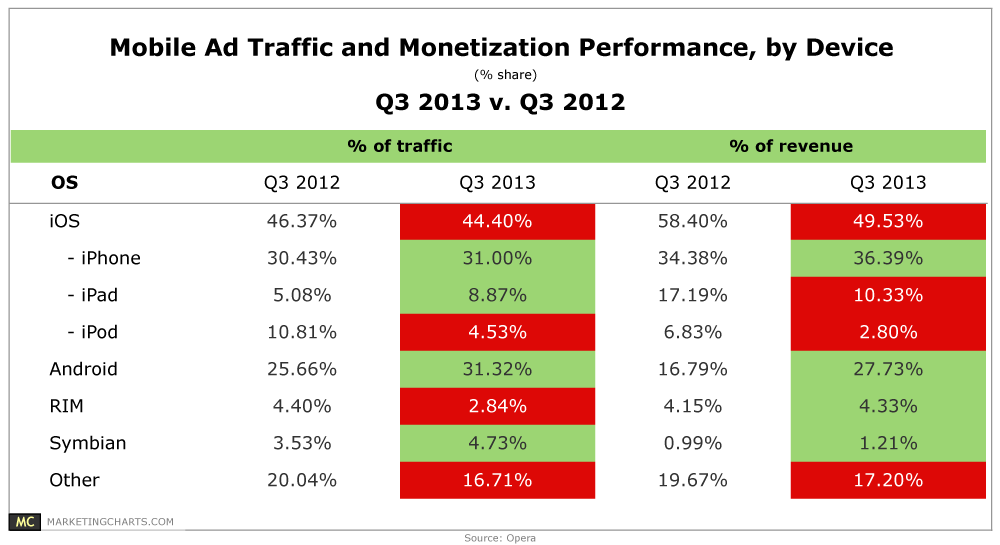
Among mobile platforms, Apple’s iOS continues to outpace Android in monetization performance on the Opera Advertising mobile platform.
Read MoreBarcode Scanners By Age, Q3 2011 vs. Q3 2013 [CHART]
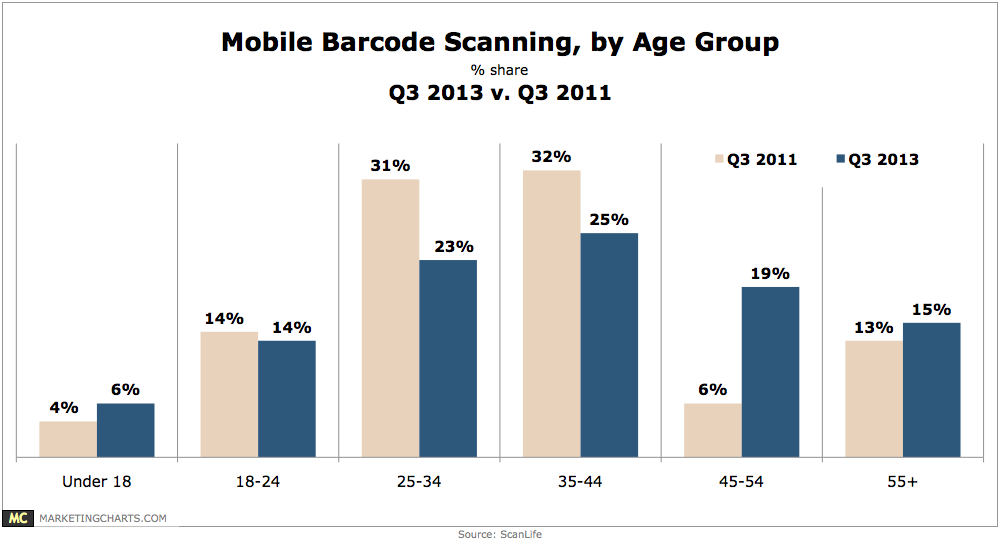
During Q3, 34% of mobile barcode scanners were in the 45-54 (19%) or 55+ (15%) age groups.
Read More