Mobile Marketing
Demographics Of Snapchat Users [TABLE]
Some 9% of cell phone owners use Snapchat.
Read MoreDell's Urine-Smelling Laptops & Branded Dog Walking Trails – Beyond Social Media Show [VIDEO]

Topics on Episode 23 of the Beyond Social Media Show: Dell’s Urine-Smelling Laptops; Twitter’s full-sized images; problems with promoted tweets; Twitter’s value to marketers; My Eco Lips; Pedigree’s dog walking trails; Google Hangouts changes; Boston Red Sox beards; some shiny new stuff & much more.
Read MoreB2B Content Marketing [INFOGRAPHIC]
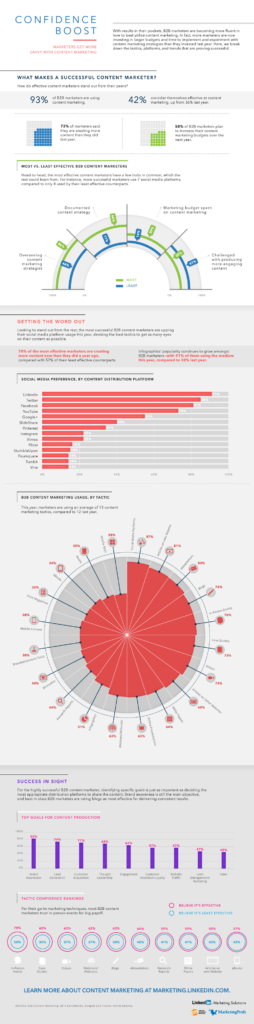
This infographic from LinkedIn illustrate’s B2B content marketing efforts.
Read MoreOnline Channels That Drive The Most CPG Revenues, July 2013 [CHART]
39% of CPG executives believed direct-to-consumer channels were driving the most digital revenues for their companies.
Read MoreUS Local Mobile Ad Spending By Format, 2012-2017 [TABLE]
BIA/Kelsey estimated advertisers in the US would invest $725 million in local mobile display advertising in 2013, which is nearly twice the amount spent last year.
Read MoreClick-Through Rates For Location-Based Ads By Targeting Type, H1 2013 [CHART]
The use of geotargeted mobile display advertising is on the rise, as are campaign results.
Read MoreDell's Urine-Smelling Laptops & Branded Dog Walking Trails – Beyond Social Media Show [VIDEO]

Topics on episode 23 of the Beyond Social Media Show: Dell’s Urine-Smelling Laptops; Twitter’s full-sized images; problems with promoted tweets; Twitter’s value to marketers; My Eco Lips; Pedigree’s dog walking trails; Google Hangouts changes; Boston Red Sox beards; some shiny new stuff & much more.
Read MoreReasons To Use Branded Mobile Apps By Demographic, February 2013 [TABLE]
A full 50% of US mobile device users said they used branded mobile apps in order to receive discounts and coupons.
Read MoreDesktop vs. Mobile Retail Website Visits By Day Of The Week, October 2013 [CHART]
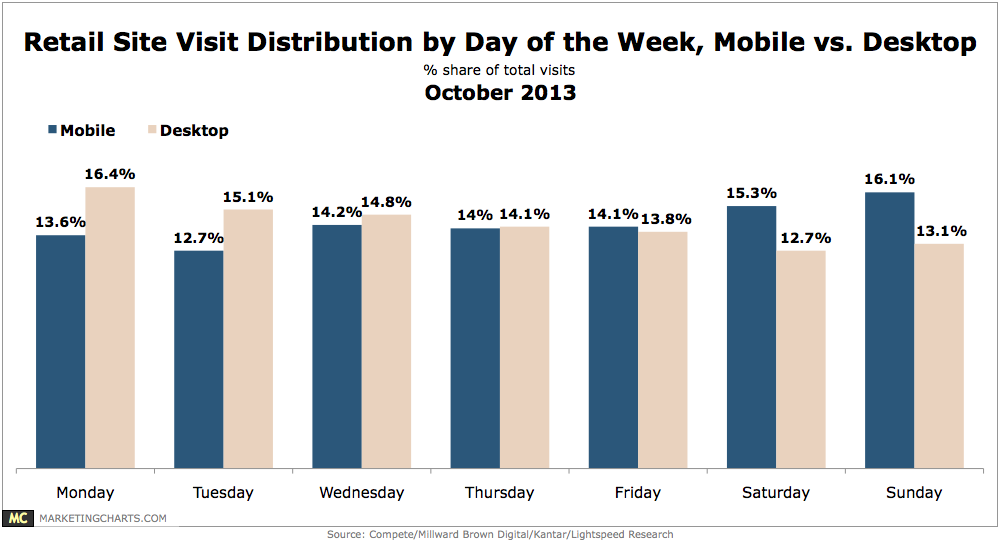
While Mondays and Tuesdays are the primary days for desktop visits (at a combined 31.5% share of total visits), Saturdays and Sundays are the most active days for mobile, with a combined 31.4% share of visits (versus 25.8% for desktops).
Read MoreDesktop vs Mobile Retail Website Visits By Daypart, October 2013 [CHART]
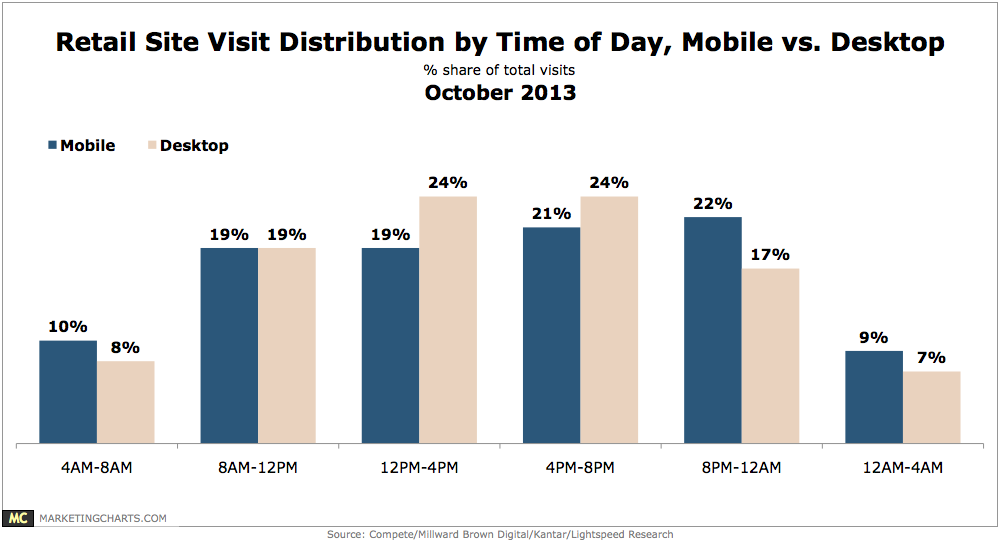
Almost half – 48% – of site visits from desktops occur between noon and 8 PM, compared to 40% of mobile visits.
Read More