Mobile Marketing
2014 Marketing Technology Landscape [INFOGRAPHIC]
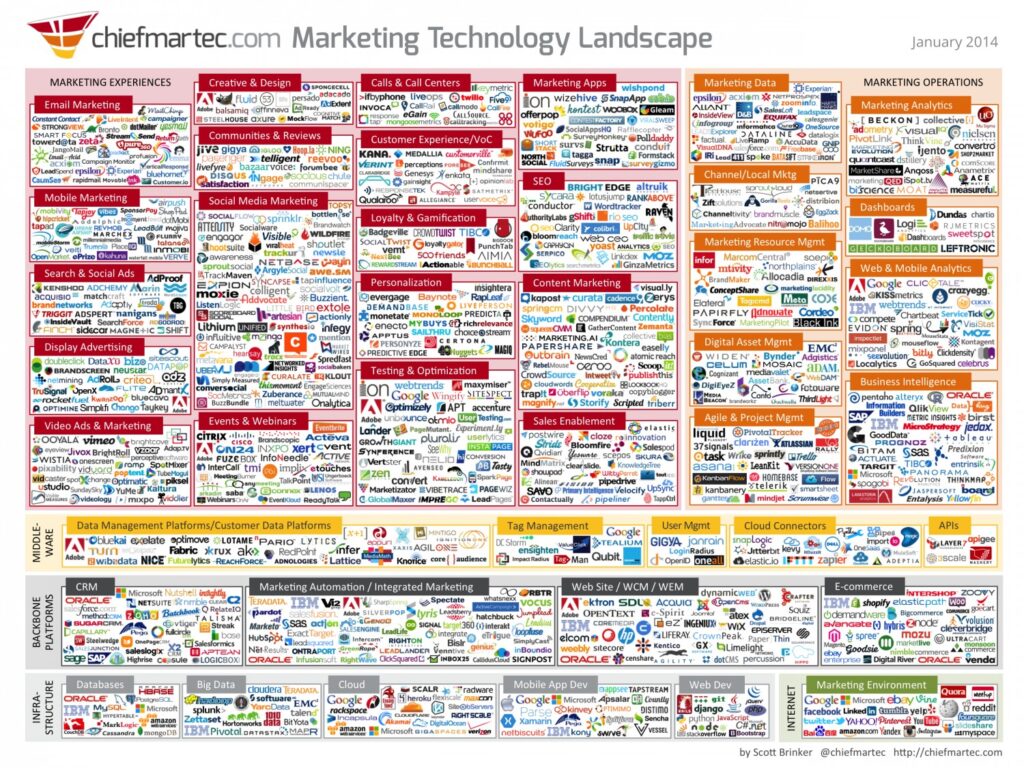
This infographic illustrates the marketing technology universe with 947 different companies that provide software for marketers.
Read MoreTechnographic Generational Gap By Device, January 2014 [TABLE]
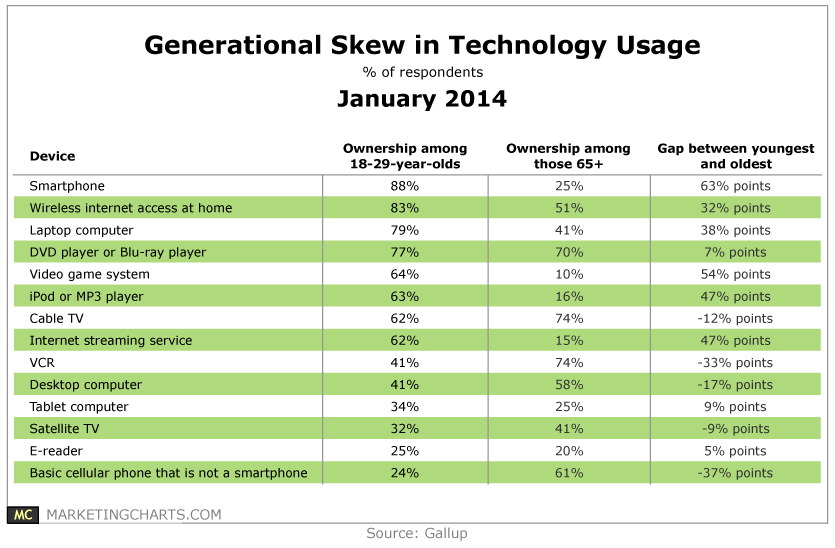
Gallup measured the penetration rates of 14 consumer electronic devices among 18-29-year-olds and those aged 65 and up.
Read MoreSocial & Mobile Marketing ROI, January 2014 [CHART]
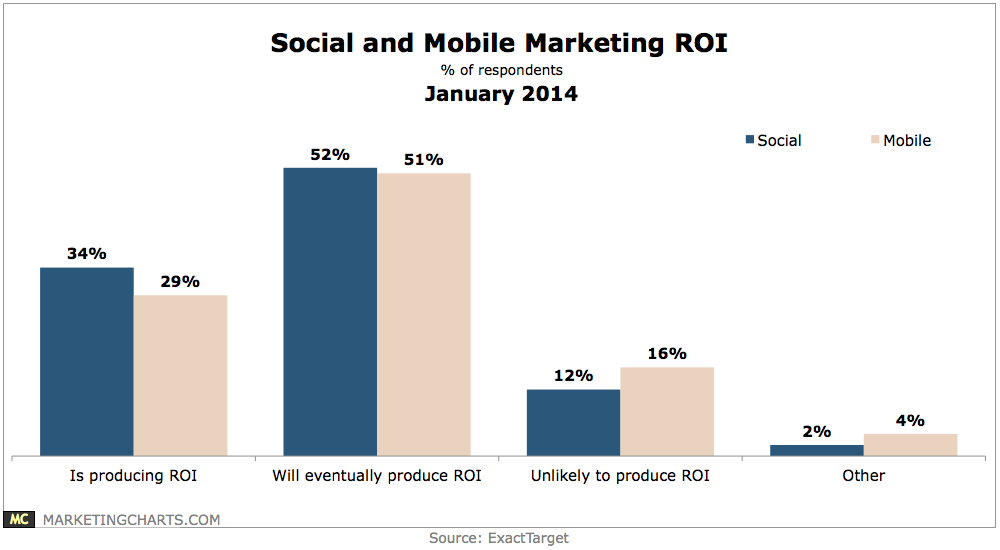
Roughly one-third of social media marketers are seeing an ROI from their efforts, while another 1 in 2 believe their activities will eventually produce a return for them.
Read MoreHoliday Purchases via Retailer's Mobile App, January 2014 [CHART]

Roughly one-third of respondents – each of whom own a smartphone, and 65% of whom own a tablet – claimed to have made a holiday gift purchase using a retailer-branded application on a smartphone or tablet during the season.
Read MoreConsumer Electronics Owned By Americans, January 2014 [TABLE]
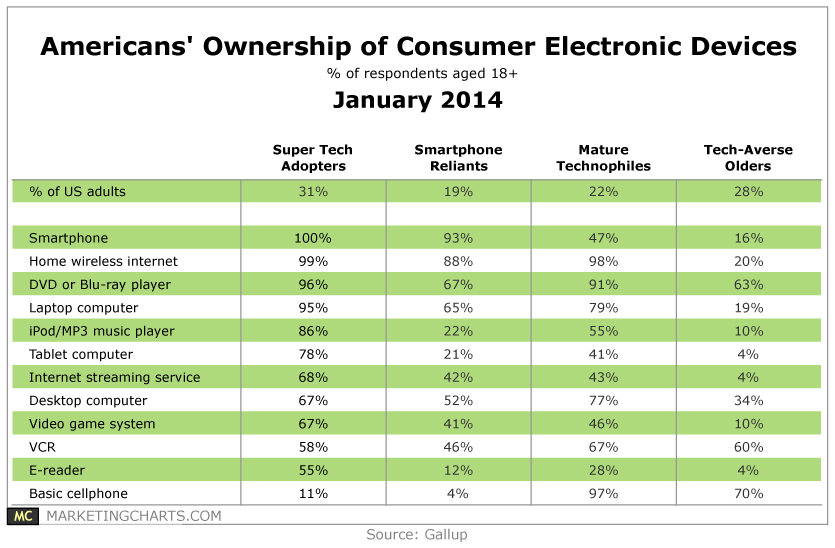
Of the 12 consumer electronics devices identified, 9 see penetration rates of 67% or higher among Super Tech Adopters.
Read MoreTop Influences Over Holiday Shopping, January 2014 [CHART]
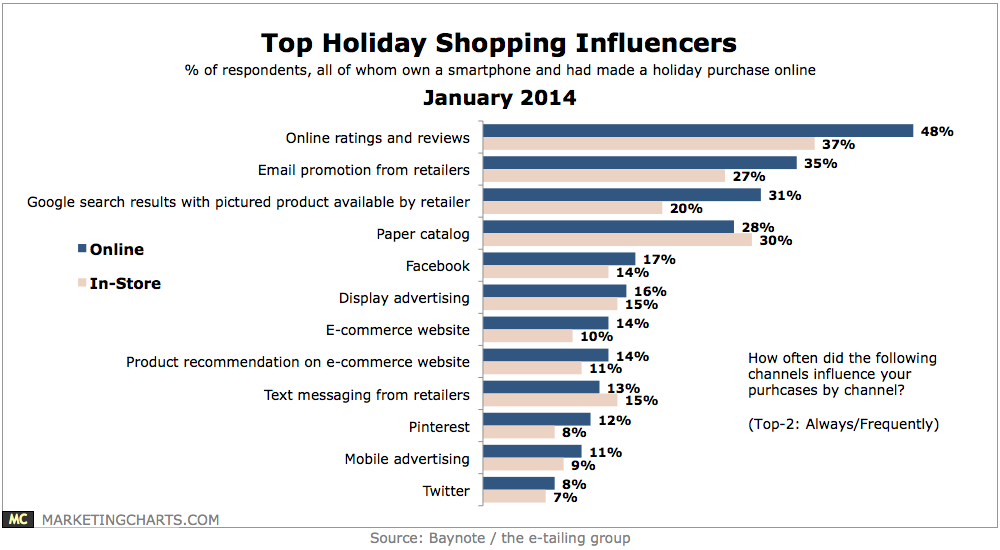
48% said online ratings and reviews frequently or always influenced their online purchases, and 37% said the same about their in-store purchases.
Read MoreUS Mobile Search Advertising Growth By Device, Q4 2013 [CHART]
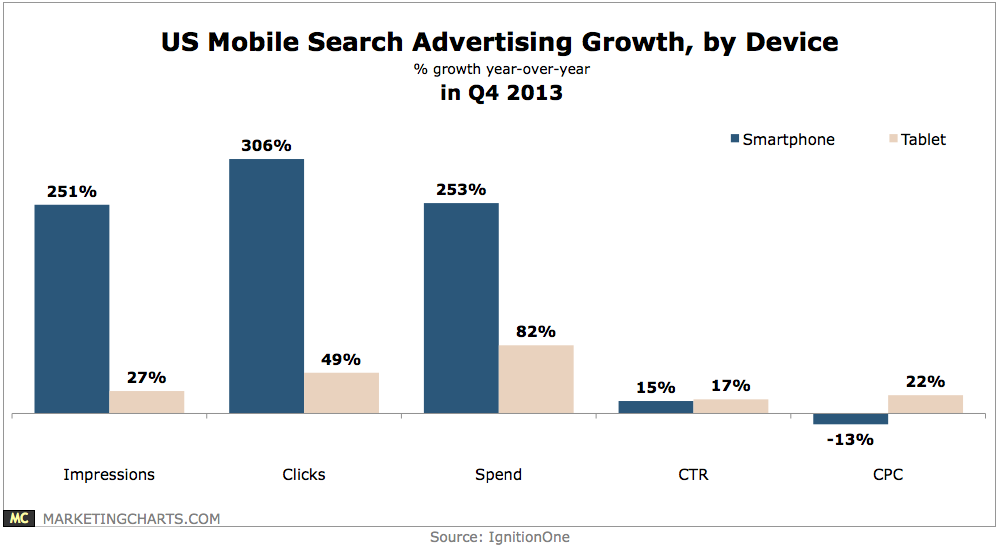
Search ad spending on smartphones soared by 253% year-over-year, while spending on tablets grew by a relatively smaller 82%, as advertisers’ targeting options were limited by Enhanced Campaigns.
Read MoreGlobal Mobile Banner Ad Interaction Rates, 2013 [TABLE]
Mobile expandable banners had greater success in engaging customers than polite banners across almost all verticals.
Read MoreGlobal Mobile Ad Click-Through Rates By Vertical, 2013 [CHART]
Mobile ads in the retail and electronics categories had the highest clickthrough rates (CTRs), at 0.52% and 0.41%, respectively.
Read MoreHow Customers Interact With Top Retailers, January 2014 [CHART]
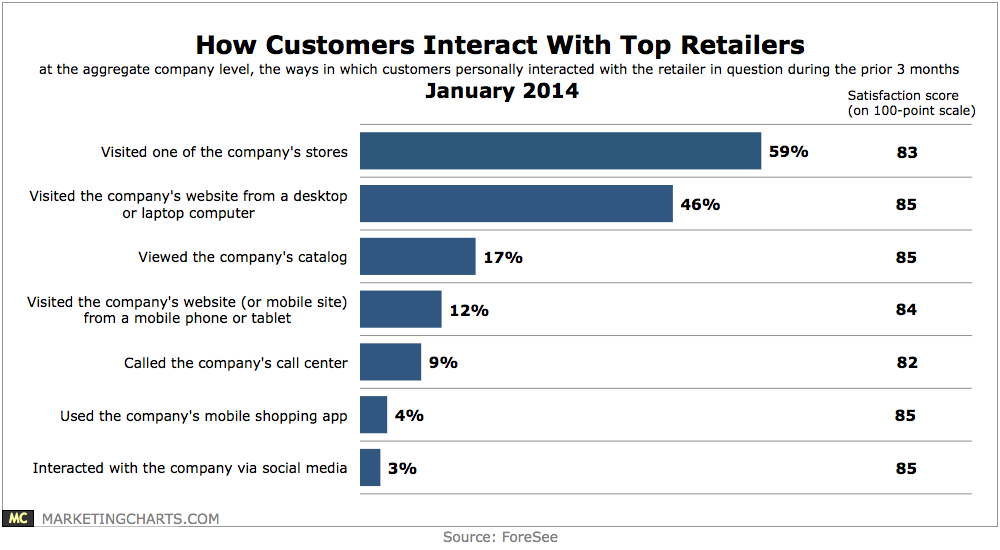
Consumers were more likely to have viewed a company’s catalog (17%) than to have interacted with the company via social media (3%).
Read More