Mobile Marketing
Tablet Experience Preferences, January 2014 [CHART]
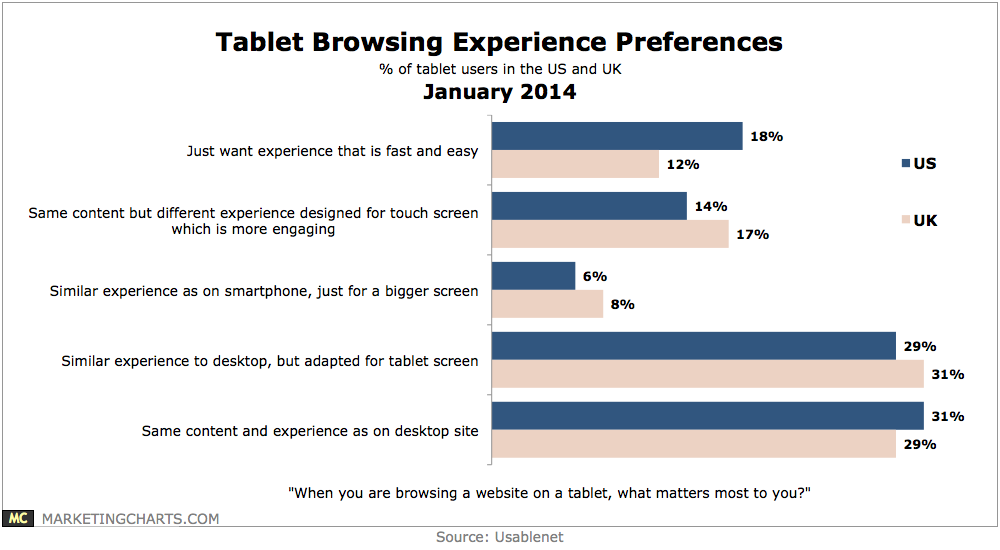
Fewer than 1 in 10 want an experience similar to the smartphone but on a bigger screen.
Read MoreFacebook Mobile Users & Ad Revenues, Q3 2012 – Q4 2013 [CHART]
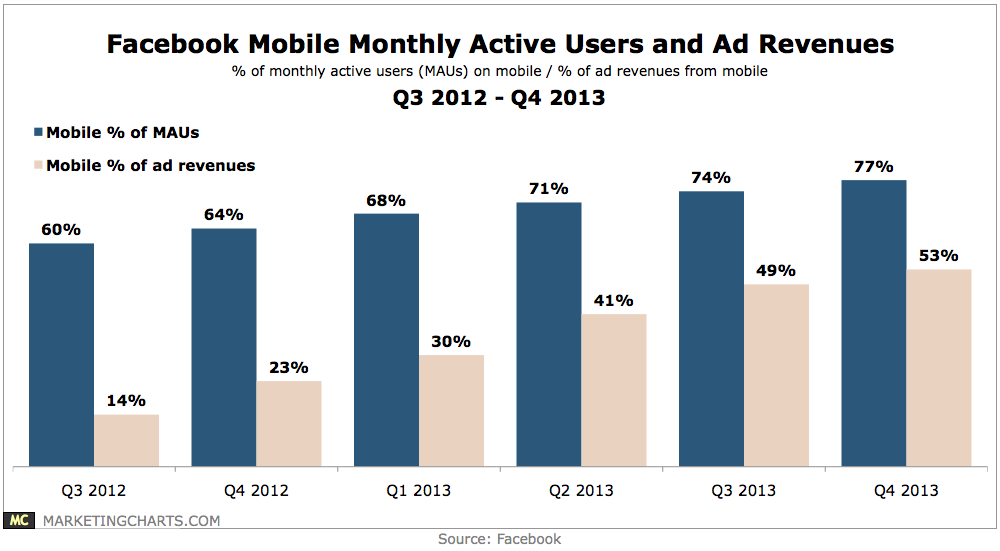
Facebook has crossed a threshold of sorts, with mobile now comprising a majority 53% share of its growing ad revenues.
Read MoreDevices Used To Read eBooks, December 2011 vs January 2014 [CHART]
A preference for dedicated eReaders over tablets seems to be eroding among eBook readers.
Read MoreAmericans Who Have Read A Book vs eBook In The Past Year, 2011-2014 [CHART]
The percentage of respondents who had read a print book over the preceding 12 months had dipped and then rebounded between 2011 and 2014, while the use of ebooks had seen steady gains.
Read MoreQuantified Self Universe [VENN DIAGRAM]
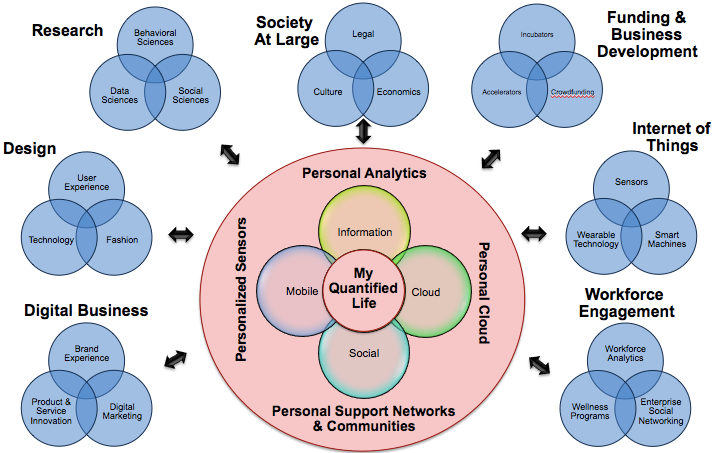
As quantified self becomes more established in the market, its intersection with mobility, social networking, and ethnography is one of the most intriguing areas of coverage.
Read MoreSocial TV & Super Bowl Ads [INFOGRAPHIC]
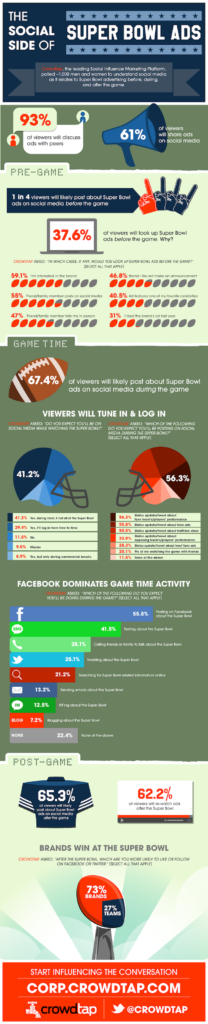
This infographic from Crowdtap illustrates the social side of Super Bowl ads.
Read MoreWhere Retailers Plan To Invest In Loyalty Marketing, April 2013 [CHART]
Retailers in North America were eyeing up increased investment in a host of loyalty marketing-related areas.
Read MoreMarketers’ Single Most Exciting Opportunity For 2014 [CHART]
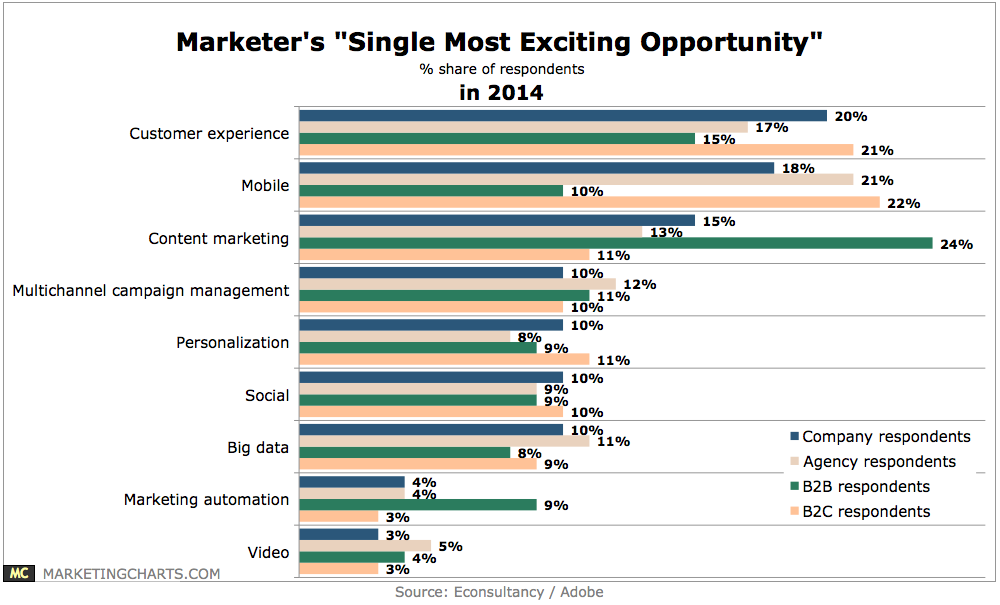
According to the global survey (which focused primarily on UK marketers), company respondents are most excited about customer experience (20%), beating out other oft-discussed topics such as mobile (18%) and content marketing (15%).
Read MoreCPG Brand Selection Influences, 2014 [CHART]
The study’s results indicate that the top decision influencer is item price, with 81% of respondents to the Q4 2013 study saying it would influence their brand decisions this year.
Read MoreHow Parents Select Mobile Apps For Their Kids, November 2013 [CHART]
Fifty-six percent of respondents looked for apps suitable for their kids’ ages.
Read More