Mobile Marketing
US Major Media Ad Spending Per Hour Spent With Media, 2010-2014 [TABLE]
Print still commands the most ad dollars—despite the fact that it’s losing in terms of absolute time spent with media at double-digit rates each year since at least 2011.
Read MoreAmericans' Daily Consumption Of Major Media, 2010-2014 [CHART]
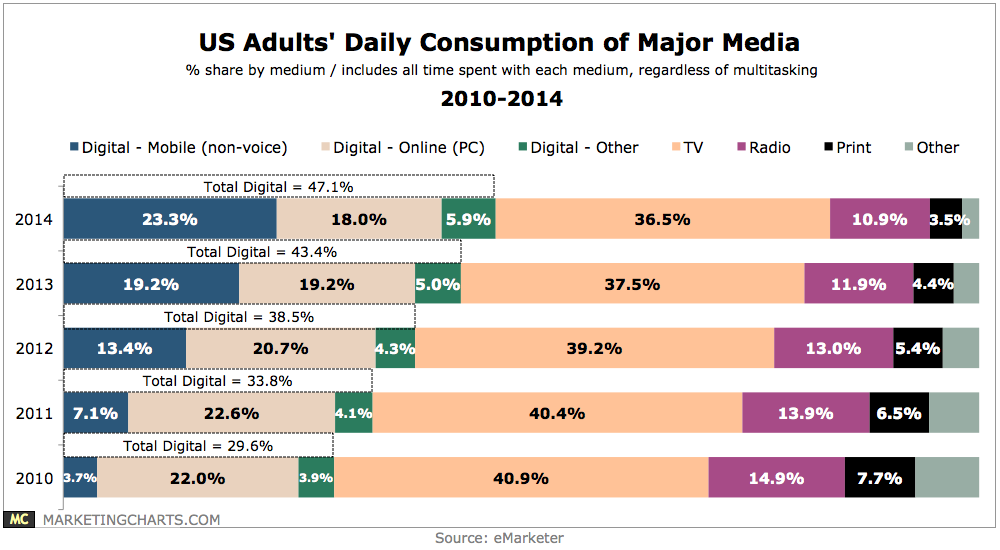
TV remains the single most-consumed medium, averaging 4 hours and 28 minutes per day, though that figure varies widely by age group.
Read MoreFacebook Mobile Advertising Metrics, Q1 2014 [TABLE]

Almost three-quarters of Facebook mobile ad spending was directed at mobile application install ads in Q1.
Read MoreAverage Daily Time Spent On Social Networks By Device, 2014 [CHART]

Social network usage among US adults has made the switch to majority-mobile this year.
Read MoreAverage Daily Time Spent Watching Video By Device, 2010-2014 [TABLE]
Mobile still accounts for a relatively small share of overall TV/video content viewing time, with an average of 33 minutes per day in 2014 out of a total 5 hours 23 minutes across all devices.
Read MoreShare Of Daily Time Spent With Major Media, 2010-2014 [TABLE]
In 2013, time spent with digital media among US adults surpassed time spent with TV for the first time—with mobile driving the shift.
Read MoreMobile Email Design [INFOGRAPHIC]

This inforgraphic from Litmus warns that 80% of people delete mobile emails that don’t look good and illustrates how to implement responsive email design.
Read MoreSearch Advertising Trends, Q1 2014 [TABLE]
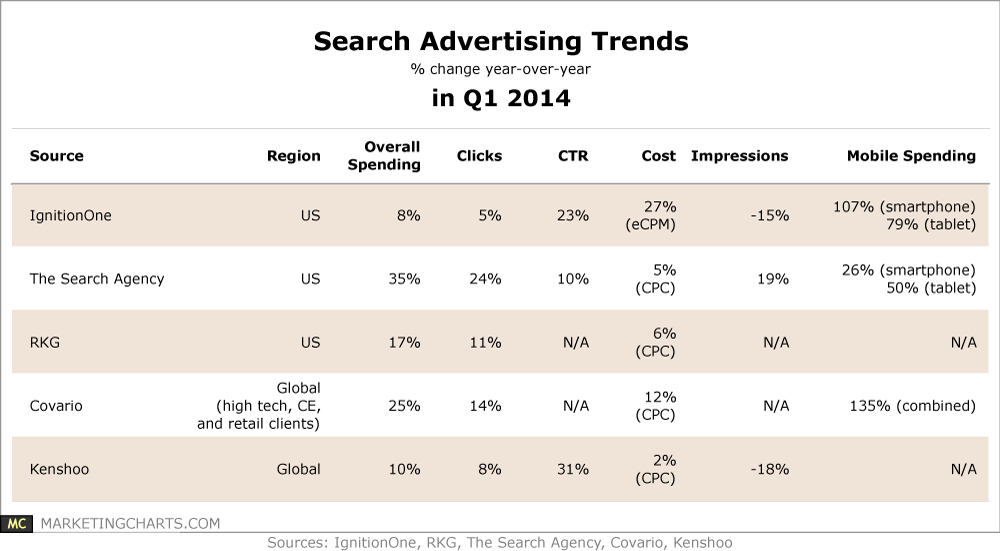
Spending is up (particularly on mobile), as are click-through rates.
Read MoreSmart Phone User Penetration In Western Europe By Country, 2012-2017 [TABLE]
The number of people in Italy owning at least one smartphone will reach an estimated 25.8 million this year.
Read MoreItalian Mobile Social Media Activities, November 2013 [CHART]

eMarketer estimates that 41.8% of the Italian population will have a smartphone in 2014—well below the regional average of 47.0%—and a similar gap will persist through 2017.
Read More