Mobile Marketing
Levels Of Suspicious US Web & Mobile Traffic, Q1 2013 – Q1 2014 [CHART]
Suspicious US web traffic was down from a high of 61% in Q4 to 55% in Q1, which Solve Media attributes to lower ad spending after the holiday season.
Read MoreMobile App Users By Frequency Of Use, March 2013 & March 2014 [TABLE]
Total mobile app users worldwide who launched apps less than 16 times daily, called Regular Users, rose by 23%.
Read MoreHow Frequently People Use Mobile Apps During The 6 Months Post-Download [TABLE]
You download an app, use it once, and it ends up lost in a sea of icons, never to be used again.
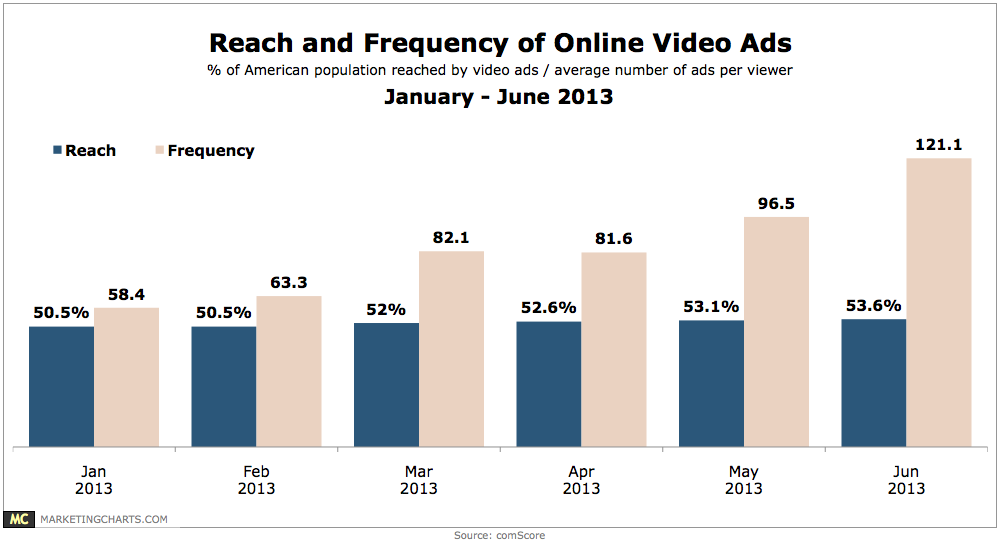
Read MoreTop Reasons For Using Video Streaming Services, Q1 2014 [CHART]
Roughly half of US and Canadian adults use monthly streaming video subscription services and more than one-quarter use pay-per-rental services.
Read MoreGerman Internet Use via PC vs. Smart Phone, Q1 2011-Q1 2014 [CHART]
92% of consumers in Germany said they owned at least one mobile phone, whether smartphone or feature phone.
Read MoreGerman Smart Phone Users By Age, 2013 & 2014 [CHART]
In May 2014, 55% of German consumers ages 14 and older said they used a smartphone at least occasionally, compared with 41% a year earlier.
Read MoreChannels Used By Nonprofit Social Media Managers, Spring 2014 [CHART]
98% of charities and nonprofits are using at least one form of social media.
Read MoreWeekly Retail-Related Mobile Activities Of Online Buyers, March 2014 [CHART]
One-quarter of respondents said they researched products on their mobile devices prior to visiting a store weekly.
Read MorePreferred Methods Of Researching & Buying From Multichannel Retailers, March 2014 [CHART]
Digital channels are now the method of choice for both product research and purchasing.
Read MoreUK Retail mCommerce Sales By Device, 2012-2018 [TABLE]
Retail sales on tablets are growing considerably faster than those on smartphones in the UK, even though smartphone usage is far more common than tablet usage.
Read More