Mobile Behavior
US Tablet Market Penetration, 2011-2017 [CHART]
This year, for the first time, the majority of US internet users will use a tablet.
Read MoreDemographics Of Instagram Users, October 2013 [CHART]
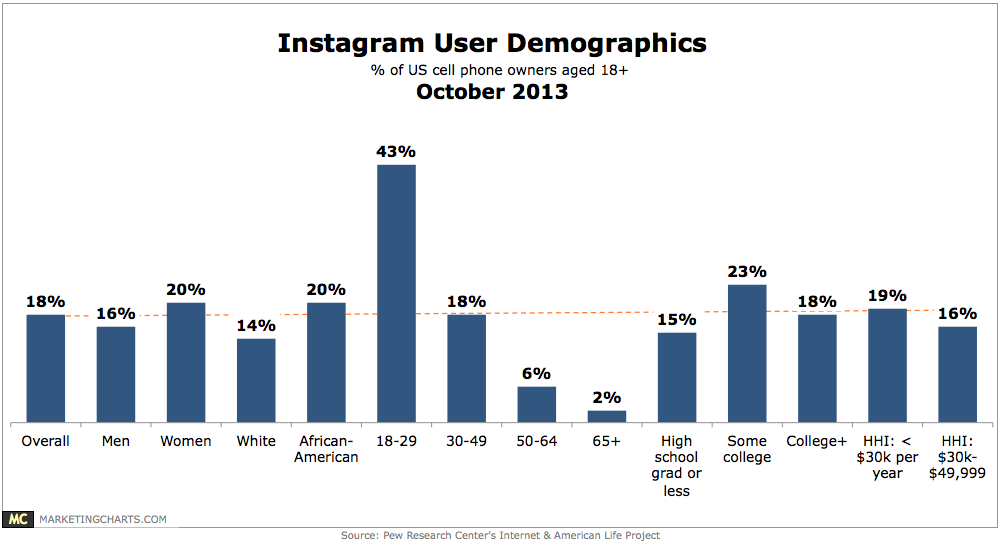
Some 20% of female cell phone users aged 18 and up use Instagram, compared to 16% of males.
Read MoreDemographics Of Snapchat Users, October 2013 [CHART]
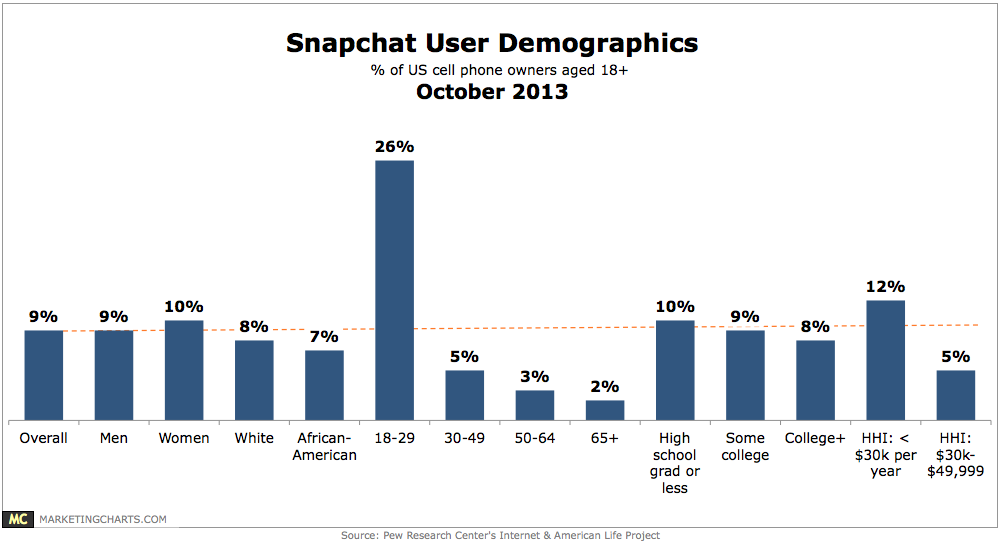
Among cell phone users, fully 26% of 18-29-year-olds report using Snapchat, a figure which plummets to 5% among 30-49-year-olds, 3% of the 50-64 crowd and 2% of those 65 and older.
Read MoreFrequency Of Instagram Use [TABLE]
Almost three-in-ten cell owners use Instagram on a weekly basis.
Read MoreDemographics Of Snapchat Users [TABLE]
Some 9% of cell phone owners use Snapchat.
Read MoreHR Technology Trends [INFOGRAPHIC]
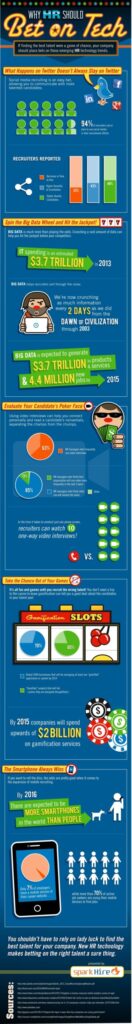
This infographic by Spark Hire illustrates some HR technology trends.
Read MoreReasons To Use Branded Mobile Apps By Demographic, February 2013 [TABLE]
A full 50% of US mobile device users said they used branded mobile apps in order to receive discounts and coupons.
Read MoreDesktop vs. Mobile Retail Website Visits By Day Of The Week, October 2013 [CHART]
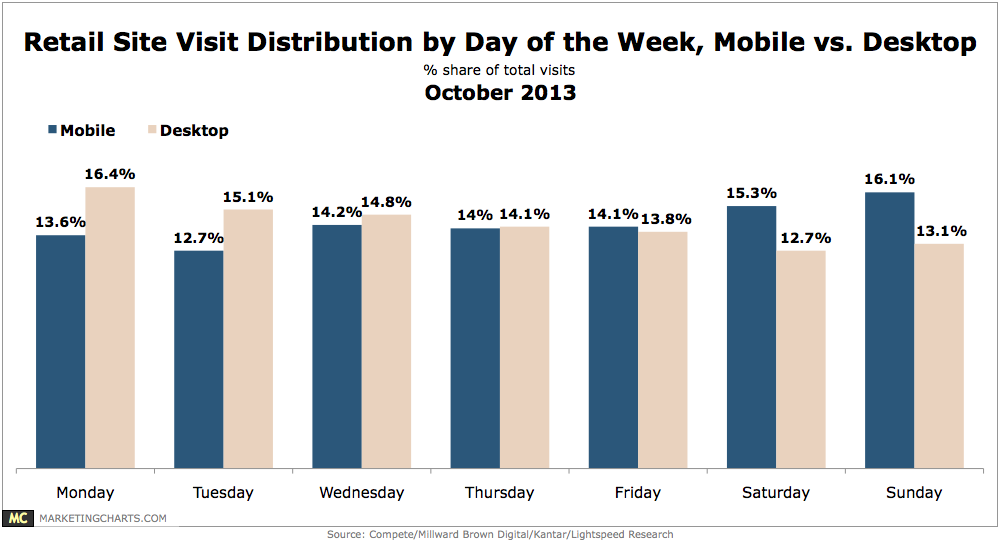
While Mondays and Tuesdays are the primary days for desktop visits (at a combined 31.5% share of total visits), Saturdays and Sundays are the most active days for mobile, with a combined 31.4% share of visits (versus 25.8% for desktops).
Read MoreDesktop vs Mobile Retail Website Visits By Daypart, October 2013 [CHART]
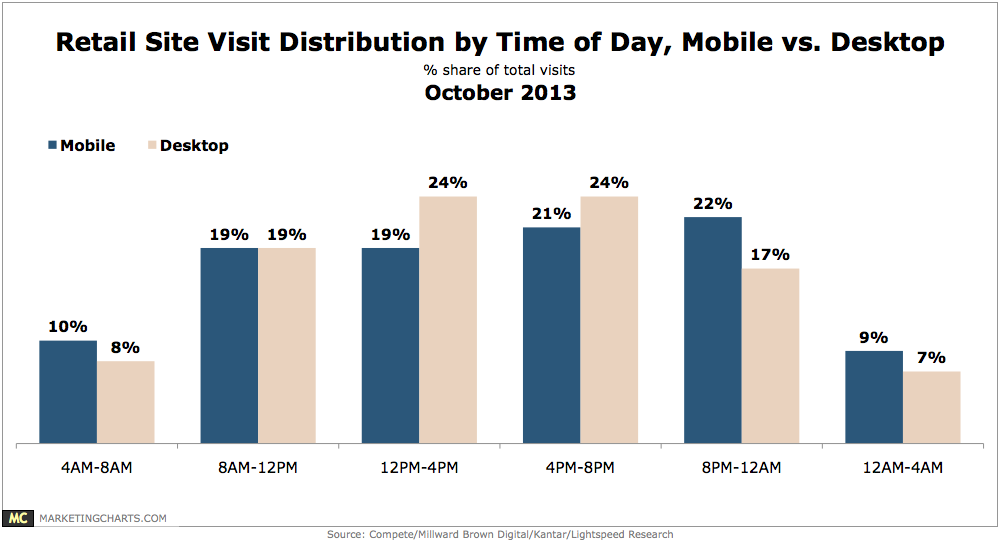
Almost half – 48% – of site visits from desktops occur between noon and 8 PM, compared to 40% of mobile visits.
Read MorePreferred Customer Channel For Insurance-Related Activities, 2013 [TABLE]
When it came to using insurance products or researching new ones, the highest number of customers preferred to do so online.
Read More