Mobile Behavior
Types Of Video People Watch On Their Smart Phones, Q3 2013 [CHART]
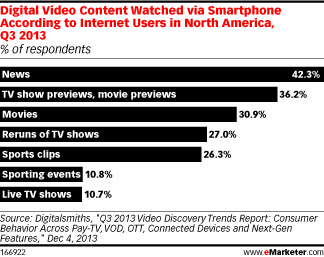
Just over 42% of internet users in North America watched news video content on their smart phones.
Read MoreImportance Of Responsive Design [INFOGRAPHIC]
This infographic by SEOcial illustrates 10 key statistics that highlight the importance of responsive design.
Read MoreGrowth Of mCommerce [INFOGRAPHIC]
This infographic by Judo illustrates the growth of mCommerce.
Read MoreComputer Activities Now Performed On Tablets, December 2013 [CHART]
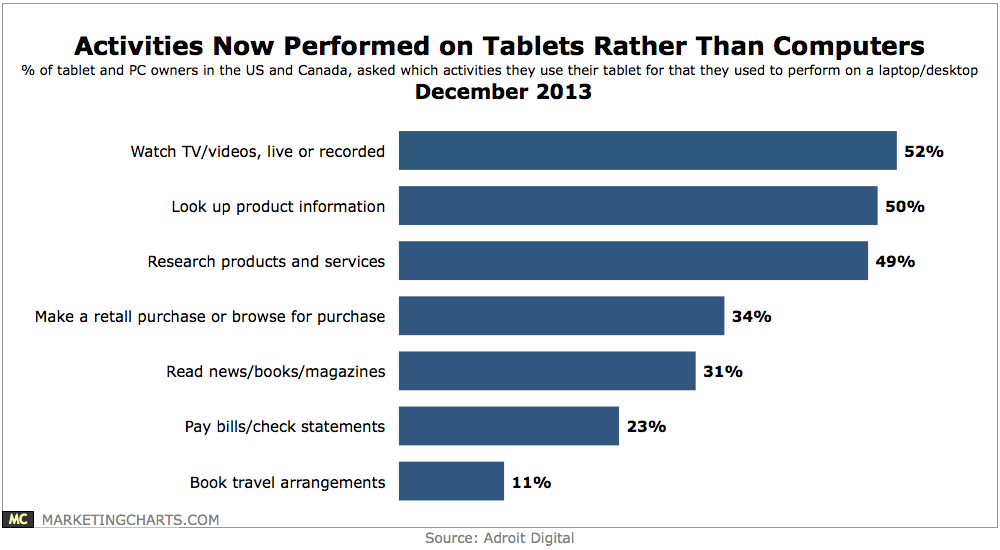
55% of respondents who own both devices would consider purchasing a tablet as a replacement for their personal laptop or desktop.
Read MoreSmart Phone Users & Downtime, December 2013 [CHART]
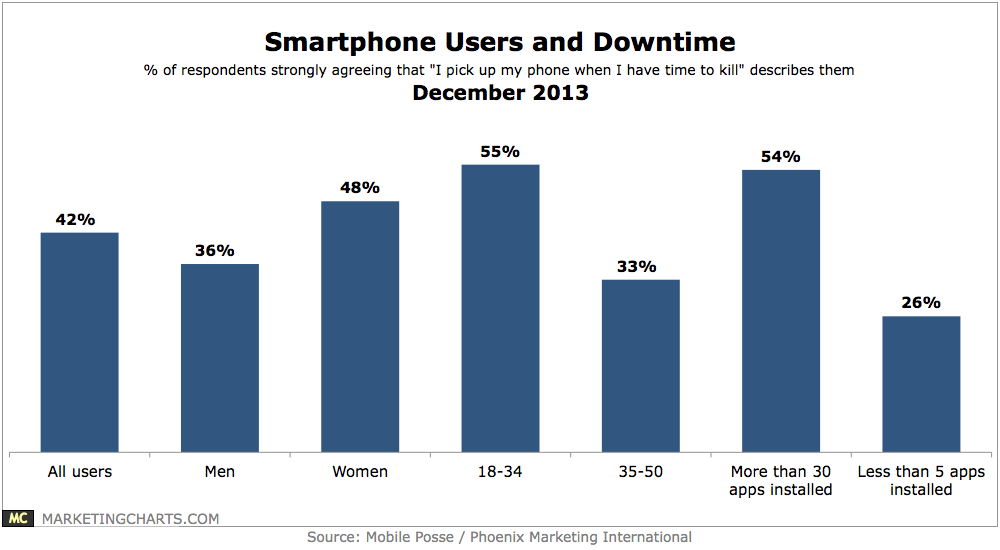
42% of respondents strongly agree that they pick up their phones when they have time to kill.
Read MoreBranded Mobile Video Content Completion Rates, Q1 – Q3 2013 [CHART]
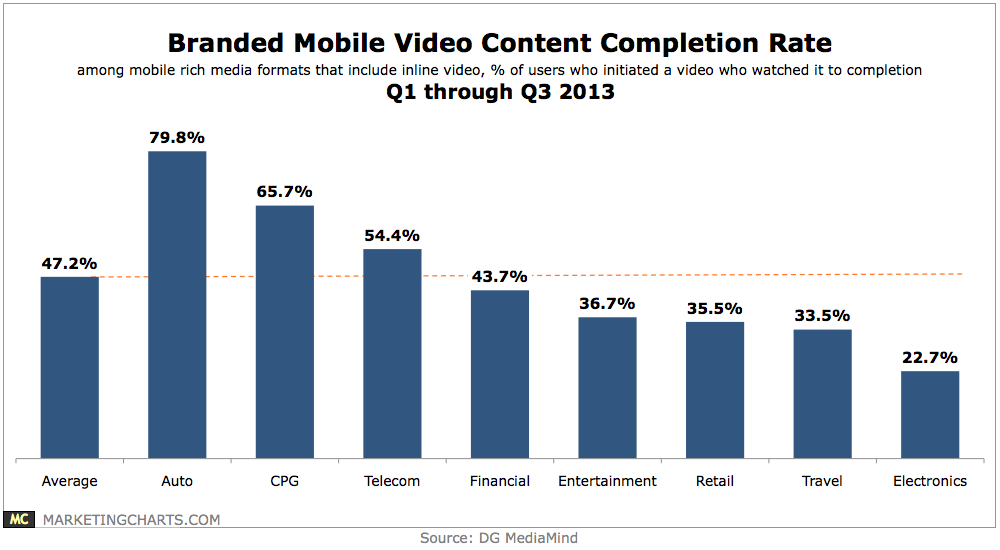
47.2% of branded videos initiated by users were watched to completion, with that figure highest for auto (79.8%), CPG (65.7%) and telecom (54.4%) advertisers.
Read MoreFrequency With Which People Check Their Mobile Bank Statements, October 2013 [TABLE]
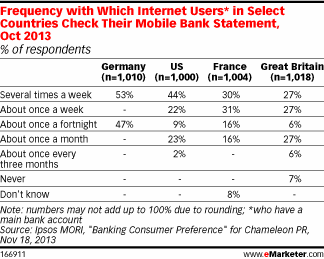
53% of Germans checked their mobile bank statement several times a week.
Read MoreHow People Get Their Bank Statements Worldwide, October 2013 [TABLE]
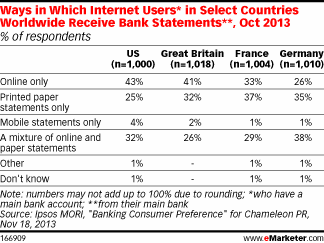
There was no clear uniformity among the countries in terms of customer preference for online or printed statements.
Read MoreShare Of eCommerce Site Visits By Device, Q3 2012-Q3 2013 [CHART]
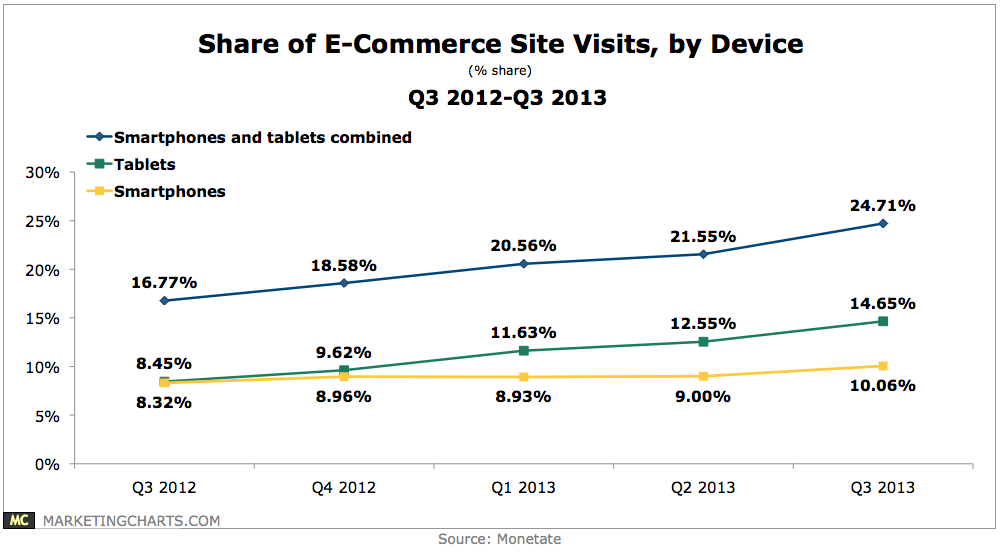
During the third quarter of the year, smart phones (10.1%) and tablets (14.7%) combined to account for roughly one-quarter of visits to eCommerce websites.
Read MoreDevices Boomers Used To Play Video Games, 2013 [CHART]
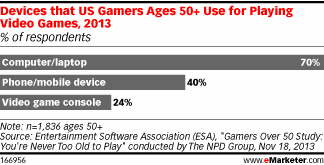
Seven in 10 gamers over 50 used a PC to play, while four in 10 used a phone or other mobile device.
Read More