Mobile Behavior
Top Challenges For Designing/Releasing Mobile Apps, October 2013 [CHART]
54%, named designing a user-friendly interface as the top challenge for using mobile apps.
Read MoreRole Of Consumer Mobile Apps In The Purchase Cycle, October 2013 [CHART]
The highest percentage of execs—31%—said the role of a mobile app during the purchase cycle was to retain customers.
Read MoreCurrent & Future Mobile App Marketing Functions, October 2013 [CHART]
The most common use of mobile apps was to communicate with customers, named by 83% of respondents.
Read MoreMobile App Use Growth By Category, 2013 [CHART]
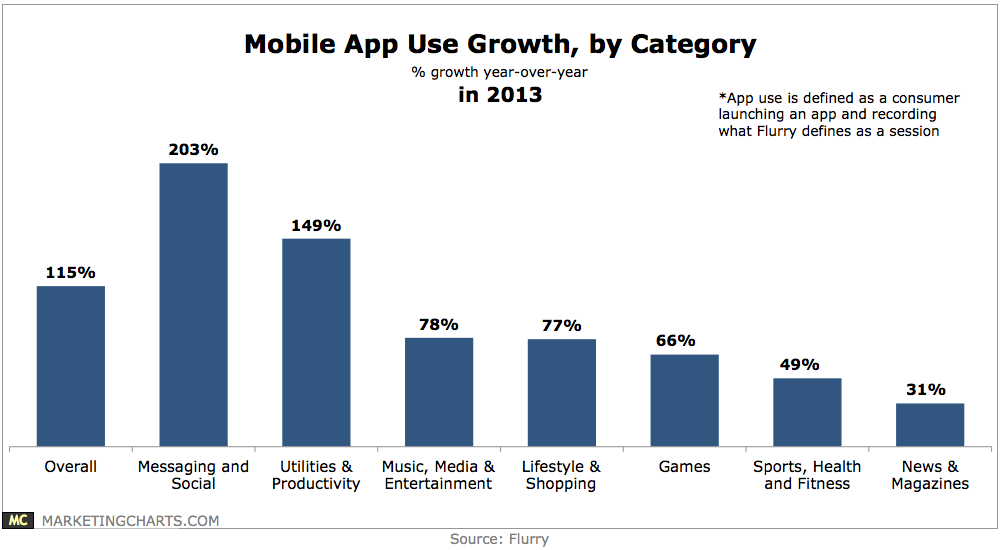
Mobile application use grew by 115% year-over-year in 2013,
Read MoreGlobal Email Open Share By Access Type, December 2013 [CHART]
More than half of email opens worldwide took place on mobile devices this past holiday season.
Read MoreInterest In Mobile Apps, January 2014 [CHART]
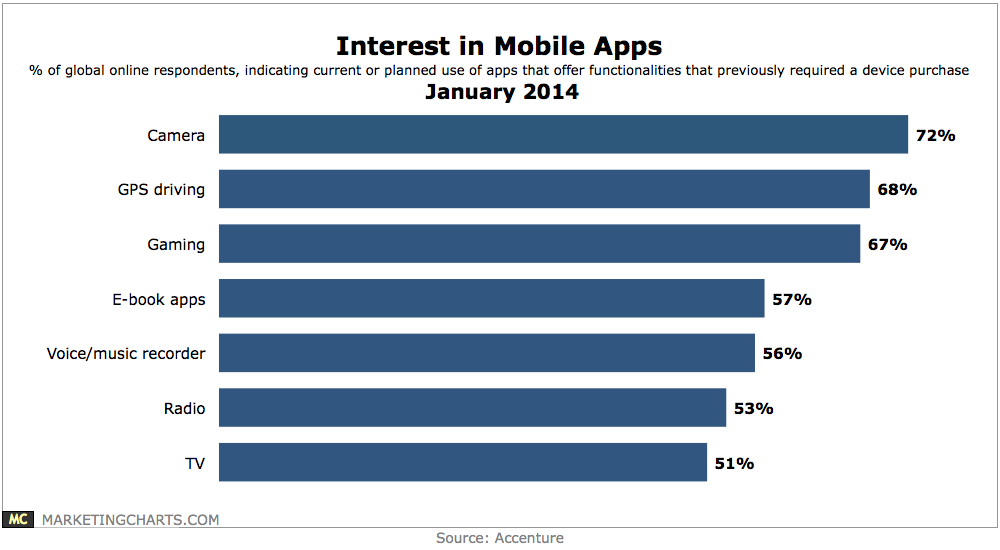
A sizable proportion of consumers from 6 major markets around the world are planning to buy smartphones (52%) and tablets (40%) over the next year.
Read MoreReasons US Smart Phone Owners Play Mobile Games By Gender, October 2013 [VIDEO]
Half of US smart phone owners cited stress relief as their reason for playing smart phone games, the No. 1 response.
Read MoreTechnographic Generational Gap By Device, January 2014 [TABLE]
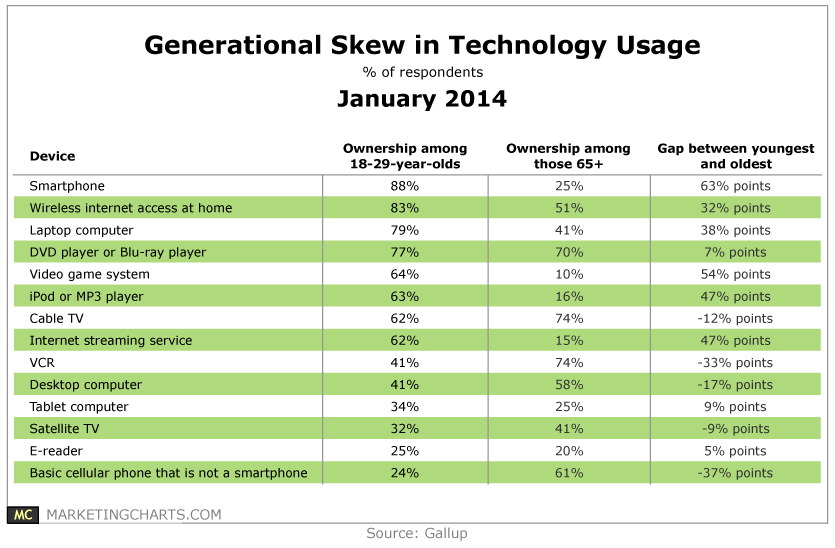
Gallup measured the penetration rates of 14 consumer electronic devices among 18-29-year-olds and those aged 65 and up.
Read MoreHoliday Purchases via Retailer's Mobile App, January 2014 [CHART]

Roughly one-third of respondents – each of whom own a smartphone, and 65% of whom own a tablet – claimed to have made a holiday gift purchase using a retailer-branded application on a smartphone or tablet during the season.
Read MoreUS Mobile Search Advertising Growth By Device, Q4 2013 [CHART]
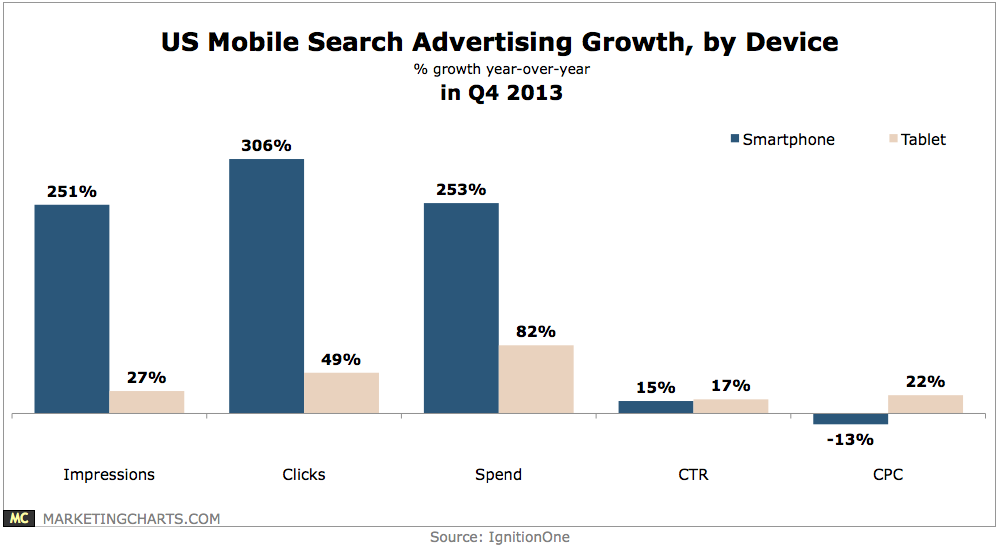
Search ad spending on smartphones soared by 253% year-over-year, while spending on tablets grew by a relatively smaller 82%, as advertisers’ targeting options were limited by Enhanced Campaigns.
Read More