Mobile Behavior
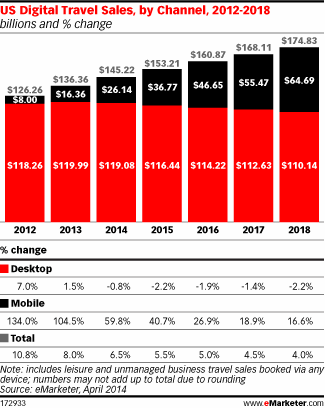
US Online Travel Sales By Channel, 2012-2018 [CHART]
US mobile travel sales totaled $16.36 billion in 2013 and will increase another 59.8% this year to reach $26.14 billion.
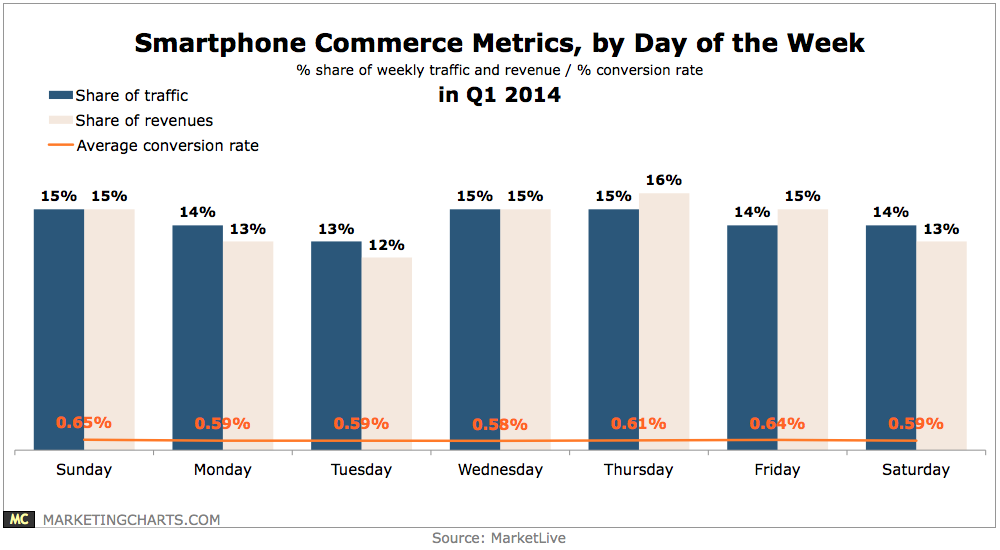
Read MoreSmart Phone Commerce Metrics By Day Of The Week, Q1 2014 [CHART]
Mondays and Saturdays tied for the second-largest share of weekly revenues (15% each).
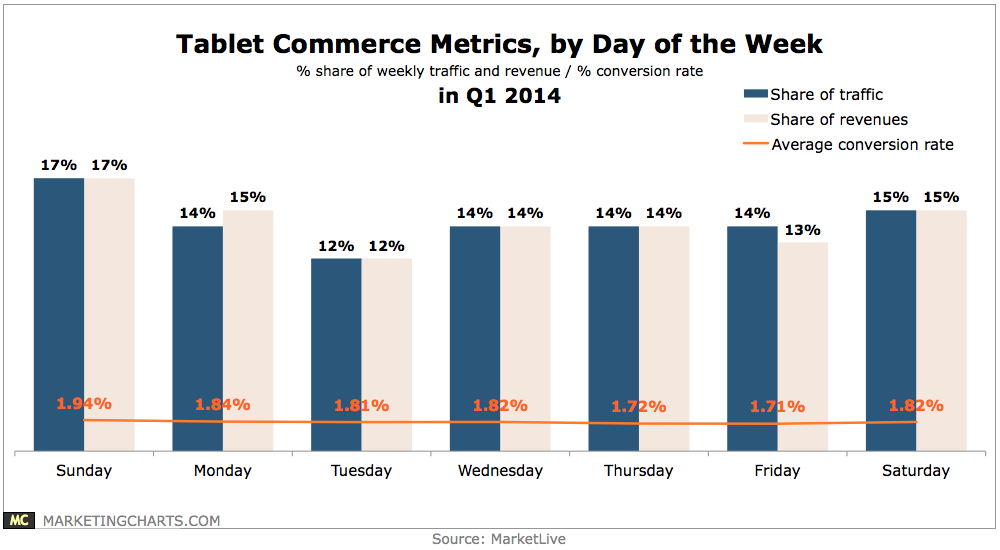
Read MoreTablet Commerce Metrics By Day Of The Week, Q1 2014 [CHART]
Mobile accounted for 10.5% of retail e-commerce spending last year.
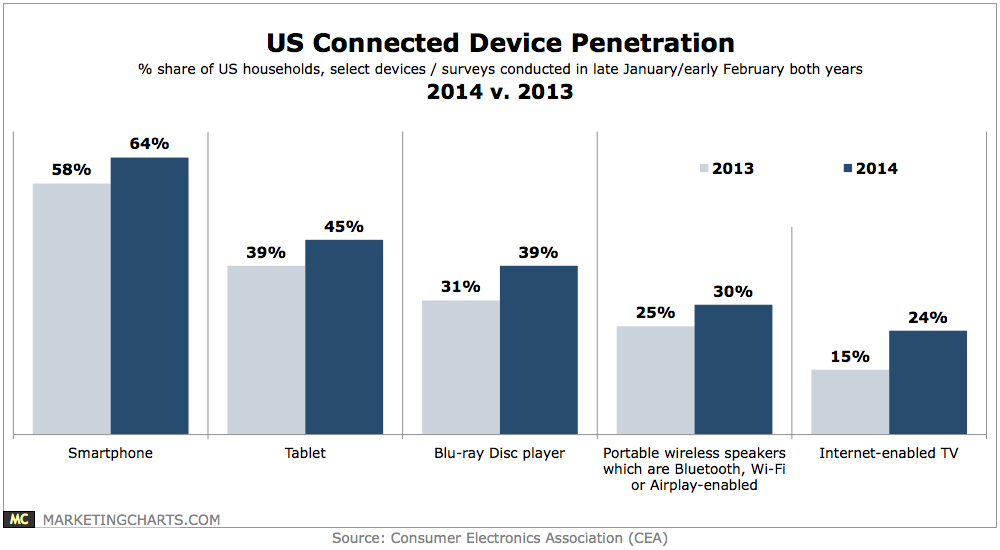
Read MoreUS Connected Device Penetration, 2013 vs 2014 [CHART]
Some 45% of households own a tablet as of late January, up 6% points from the comparable period last year, and 16% plan to purchase one this year.
Read MoreEmail's Marketing Engagement [INFOGRAPHIC]
This infographic by Sikich illustrates the effectiveness of email marketing and offers 10 tips to help you break through the clutter.
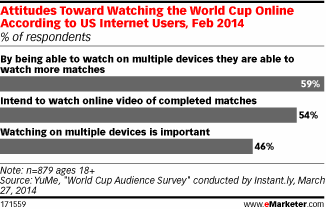
Read MoreAttitudes Toward Watching The World Cup Online, February 2014 [CHART]
Nearly half of adult US internet users said that being able to watch the soccer games on multiple devices was important to them.
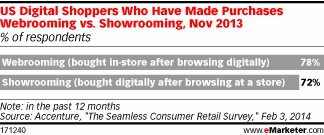
Read MoreWebrooming vs Showrooming, November 2013 [CHART]
78% of respondents reported Webrooming, or researching online before heading to a store to make a purchase.
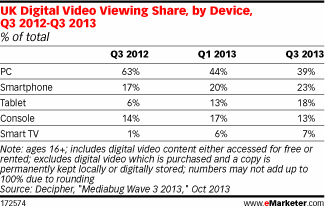
Read MoreUK Online Video Viewing Share By Device, Q3 2012-Q3 2013 [TABLE]
Smart phones were accounting for a growing proportion of digital video viewing among the general UK population—up from 17% in Q3 2012 to 23% in Q3 2013.
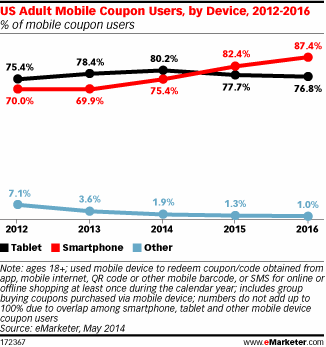
Read MoreAmerican Mobile Coupon Users By Device, 2012-2016 [CHART]
Mobile coupon users will be slightly more likely to redeem a coupon or code via tablet than smartphone in 2014.
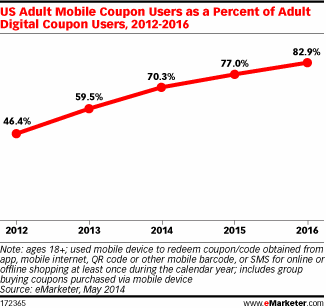
Read MoreAmerican Mobile Coupon Users As A Percent Of Online Coupon Users, 2012-2016 [CHART]
More than 70% of US adult digital coupon users will redeem a coupon or code on a mobile device for online or offline shopping in 2014.
Read More