Mobile Behavior
Average Time Spent Per Day By Device, 2010-2014 [TABLE]
In a marketing world driven ever more by data, content marketing remains very much an art form, especially in the business-to-consumer arena.
Read MoreMultitainment Behavior Of World Cup Viewers [CHART]
Facebook tied with SMS for the top way US smartphone users following the FIFA World Cup planned to communicate with others about games while watching.
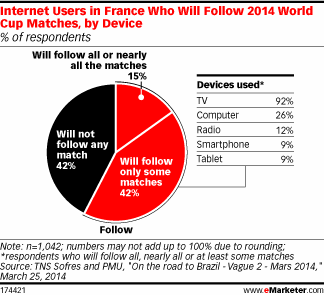
Read MoreFrench 2014 World Cup Watchers By Device [CHART]
Out of the 57% of internet users in France who said they would follow at least some of the tournament’s games, just 9% planned to use a smartphone to do so.
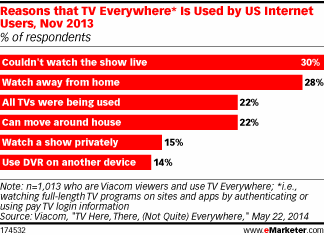
Read MoreReasons People Watch TV Everywhere, November 2013 [CHART]
Flexibility is the main reason today’s busy, on-the-go consumers are taking advantage of TV Everywhere.
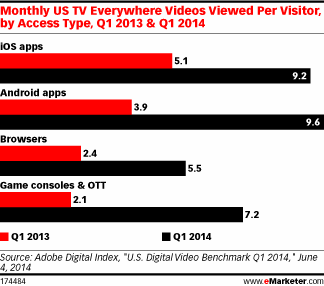
Read MoreMonthly TV Everywhere Videos Viewed By Device, Q1 2013 & Q1 2014 [CHART]
The number of unique TV Everywhere visitors in the US rose 157% between Q1 2013 and Q1 2014 and 49% between Q4 2013 and Q1 2014.
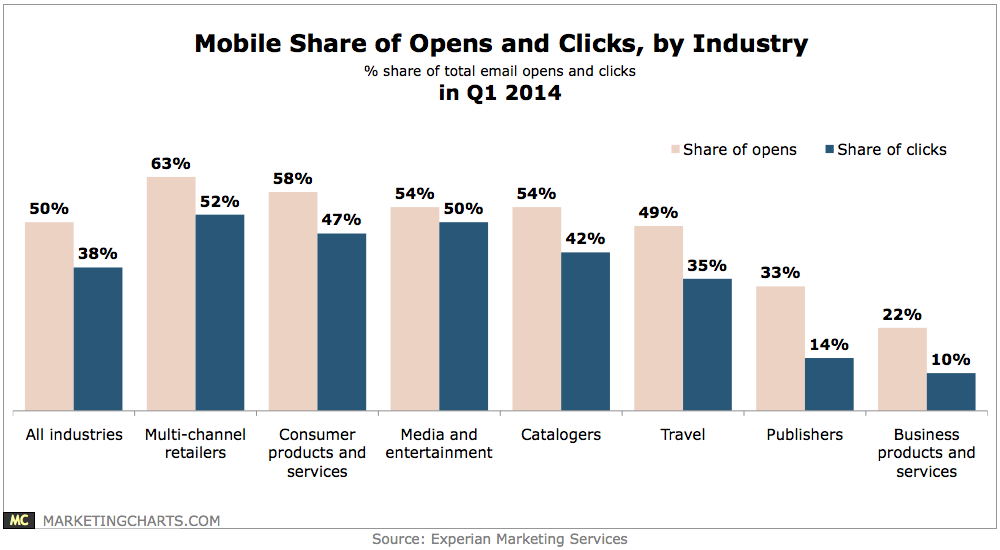
Read MoreMobile Email Benchmarks By Industry, Q1 2014 [CHART]
Half of total email opens occurred on a mobile device in Q1 2014.
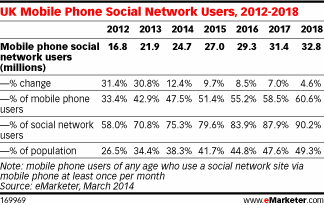
Read MoreUK Mobile Social Networkers, 2012-2018 [TABLE]
The boom times for social network adoption in the UK look to be largely over, as new user growth is set to slow to a near standstill by 2018.
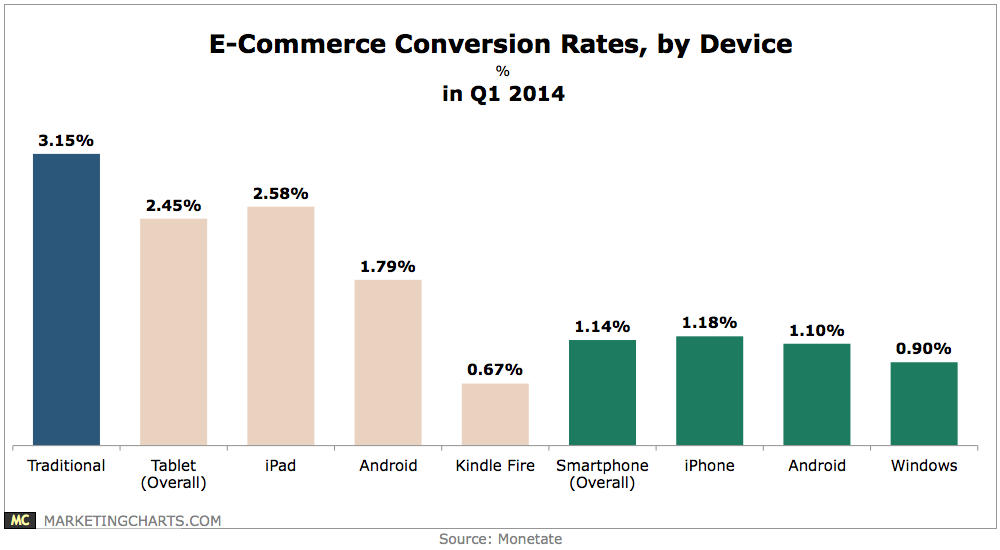
Read MoreE-Commerce Conversion Rates By Device, Q1 2014 [CHART]
Tablet (2.45%) and smartphone (1.14%) conversion rates trailed traditional computers (3.15%) again in Q1.
Read MoreMarketing & The 2014 World Cup [INFOGRAPHIC]
This infographic from Offerpop illustrates marketing efforts that are taking advantage of World Cup fever.
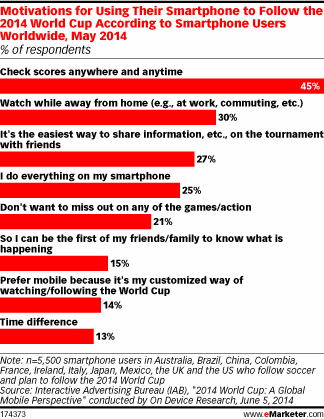
Read MoreReasons People Use Their Smart Phone To Follow World Cup, May 2014 [CHART]
Being able to stay in the know about World Cup scores was the top motivation for using their phones.
Read More