Mobile Behavior
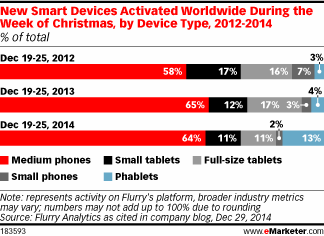
New Smart Devices Activated Christmas Week By Type, 2012-2014 [CHART]
Phablet devices activated worldwide during the week of Christmas accounted for 13% of total activations—up 225% year over year.
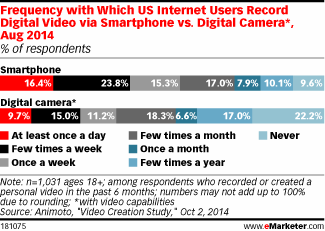
Read MoreFrequency Of Video Recording By Smart Phone & Digital Camera, August 2014 [CHART]
Web users were using smartphones much more frequently than digital cameras for video recording.
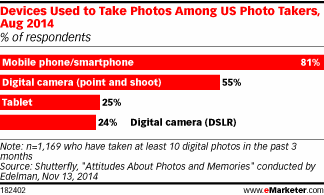
Read MoreDevices People Use To Take Photos, August 2014 [CHART]
The majority of US consumers now use smartphones—eMarketer estimates that penetration will reach 51.8% this year.
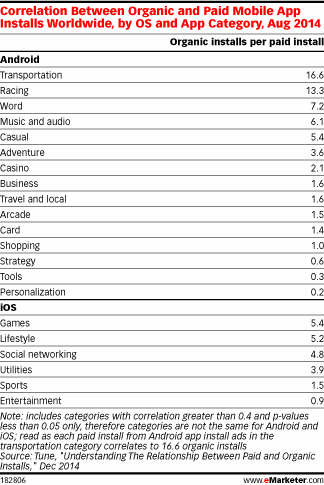
Read MoreCorrelation Between Organic & Paid Mobile App Installs, August 2014 [TABLE]
In most app categories, there is a correlation between paid app installs and organic distribution of the same apps.
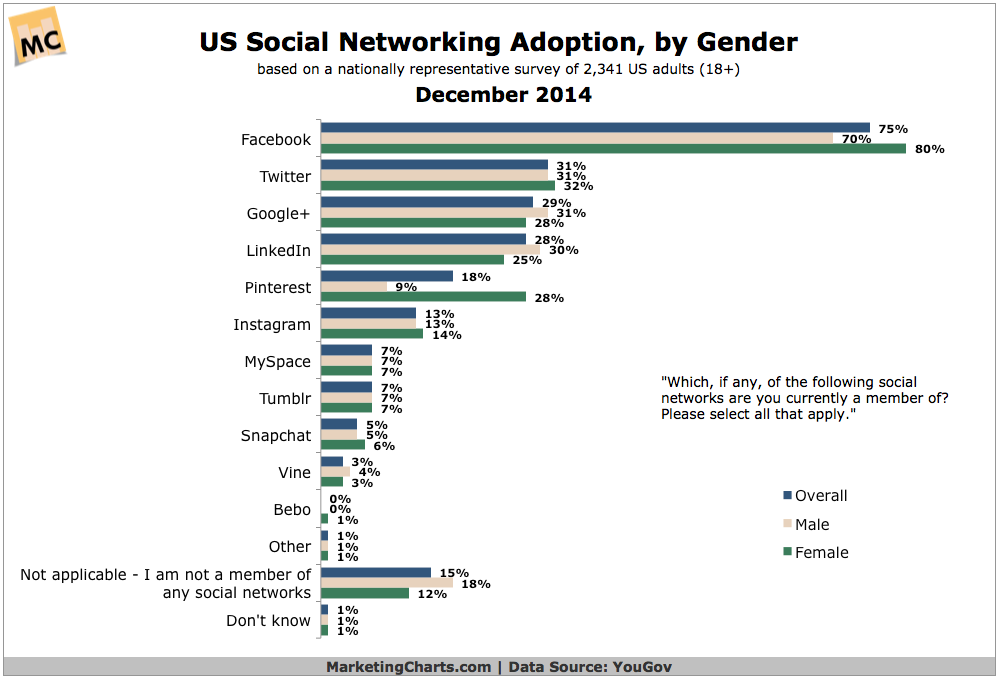
Read MoreUS Social Network Adoption By Gender, December 2014 [CHART]
Only 15% of US adults say they are not a member of any social networks.
Read MoreDevice Ownership Among American Kids, October 2014 [CHART]
The majority of US children and teens under 18 have access to some sort of digital device.
Read MorePreferred Channel For Customer Service Inquiries, September 2014 [TABLE]
Social networks were hardly ever the preferred channel for making customer service inquiries.
Read MorePersonalization's Effect On ROI, December 2014 [CHART]
Almost 6 in 10 company marketers agree that the ability to personalize content is fundamental to their online strategy.
Read MoreApp Push Message Click Rates, November 2014 [CHART]
App push messages sent during the week have on average 66% higher click-through rates than those sent on the weekend.
Read MoreFrequency With Which Mobile Moms Use Devices While Watching TV, July 2014 [CHART]
76% of mothers share their TV-viewing time with internet usage, up from 66% in 2013.
Read More