Mobile Behavior
Time Spent With Mobile Apps By App Ranking
Overall, the top 50 apps ate up 58% of US users’ app time, Nielsen determined.
Read MoreTime Spend With Mobile Apps vs Mobile Web [CHART]
According to Nielsen, US Android and iOS app users spent 101 billion minutes per month with their apps in March 2012, more than double the amount from a year earlier.
Read MoreFrequency Of Mobile Video/TV Consumption Among US Smart Phone/Tablet Users [TABLE]
According to an April comScore MobiLens study, 53% of US tablet users watched mobile video or TV at least once that month, compared to only 20% of smartphone users.
Read MoreFrequency Of Tablet Use At Work [CHART]
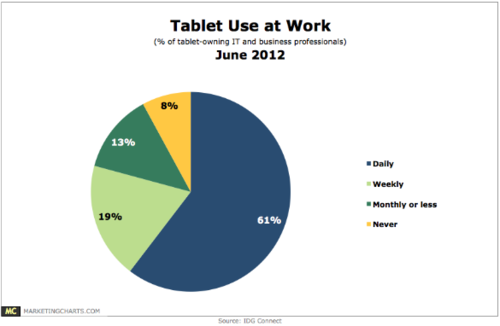
via marketingcharts.com Tablets are increasingly becoming a staple at work for the corporate professional, according to research released in June 2012 by IDG Connect. 71% of the more than 3,000 IT and business professionals responding to the survey said they already own a tablet, with roughly 3 in 5 using it daily for work. Breaking…
Read MoreLocation-Based Services Use Frequency [CHART]

via emarketer.com About one-third of respondents said they had increased their use of such services over the past year, while another third said their use had stayed about the same. Only 10% of those polled had reduced their use of geolocation apps or other products. Read the rest at eMarkerter.
Read MoreTablet Owners Who Have Made A Purchase On Their Tablet by Generation [CHART]
via emarketer.com When looking at US tablet ownership and usage by age group, Jumptap found that those ages 25 to 34 led the pack. Almost one-quarter of those in this group owned a tablet, while about one in five said they had made a purchase on one of the devices. Interestingly, those ages 18 to…
Read MoreMultitainment Behavior By Device [CHART]
Part of the increase in online activity by consumers is no doubt occurring when they are watching television.
Read More