Mobile Behavior
US Retailer Purchase & Fulfillment Options, 2012 & 2017 [CHART]
Although only 39% of retailers enabled shoppers to buy on mobile, then ship to home, 59% planned to do so by 2017.
Read MorePost Mobile Ad-Viewing Acts [CHART]
22% of US smartphone users had made an online purchase via PC after seeing a mobile ad, more than quadruple the percentage who had purchased on their phone.
Read MoreTop 10 TV Programs & Events By Social Chatter [TABLE]
The number of social conversations about TV on several leading social sites rose from just over 10 million in June 2011 to over 81 million by June 2012.
Read MoreMobile Phone Use For TV Content By Generation [CHART]
32% of cell owners used their mobile devices to find television-related content.
Read MoreCell Phones As A Distraction From TV By Generation [CHART]
38% of adult cell owners reported using their mobile device to keep themselves occupied during commercials or other breaks in a program.
Read MoreDemographics Of Cell Phone Owing TV Viewers [TABLE]
Half of all adult cell owners (52%) have used their phones recently for engagement, diversion, or interaction with other people while watching TV.
Read More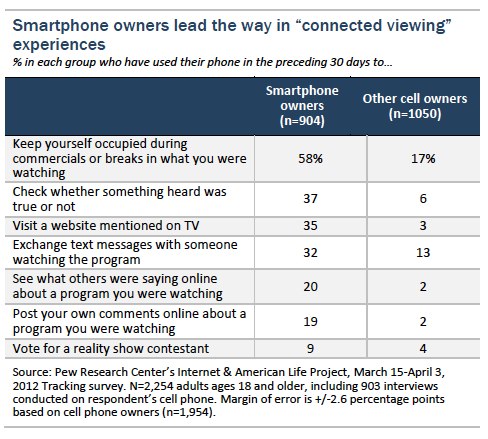
Content Consumption Of American Smart Phone Users [CHART]
Gaming was a significantly less popular activity on smart phones, according to a study of US internet users conducted by Frank N. Magid Associates.
Read MoreContent Consumption Of American Tablet Users [CHART]
On average, tablet gamers downloaded 22 games over the past year, according to a study of US internet users conducted by Frank N. Magid Associates for gaming company PlayFirst.
Read MoreTop Mobile Hotel Services Wanted By American Business Travelers [CHART]

Fully 79% of business travelers said they would avail themselves of check-in and checkout services offered on mobile.
Read More