Mobile Behavior
Online Shopping Behavior Of The Wealthy, December 2012 [TABLE]
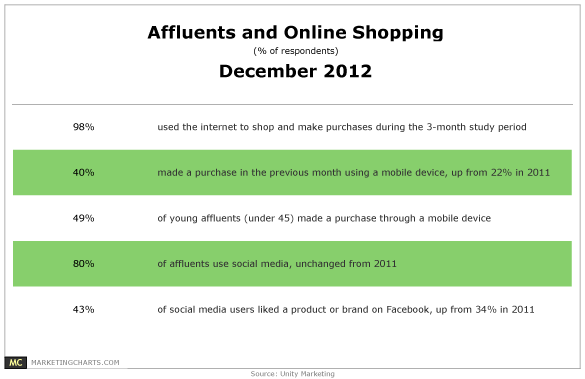
Virtually all (98%) affluent consumers use the internet to shop and make purchases.
Read MoreeMoney [INFOGRAPHIC]
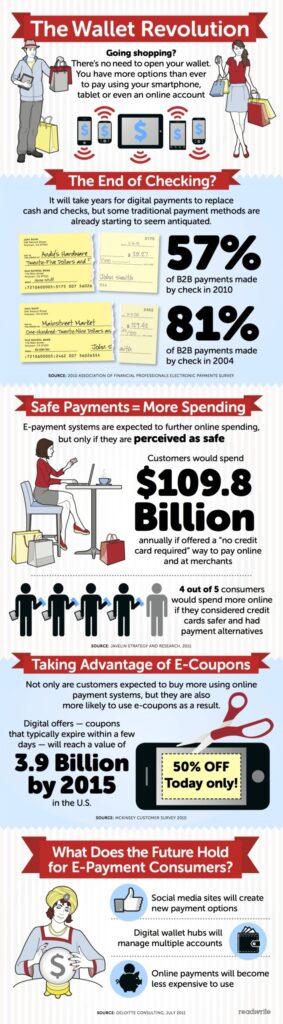
This ReadWrite infographic offers some key data points on the path to digital money.
Read MoreTime Spent Online By Activity & Device, 2012 [CHART]
Social media captures 31% of smartphone internet time, compared to 18% of PC internet time.
Read MoreTime Spent Online By Device, 2011 vs 2012 [CHART]
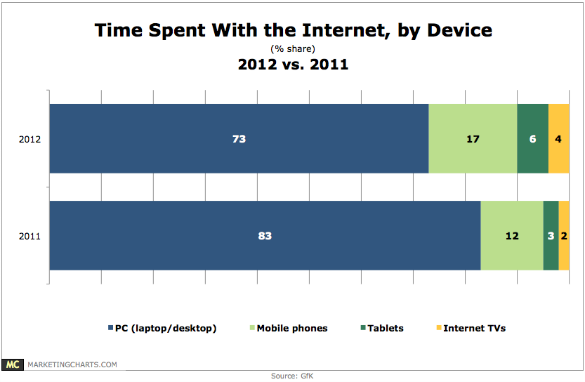
While desktop and laptop computers accounted for 83% of total time spent online last year, that dropped by 10% points to 73% this year.
Read MoreMobile Gaming By Time Of Day, December 2012 [CHART]
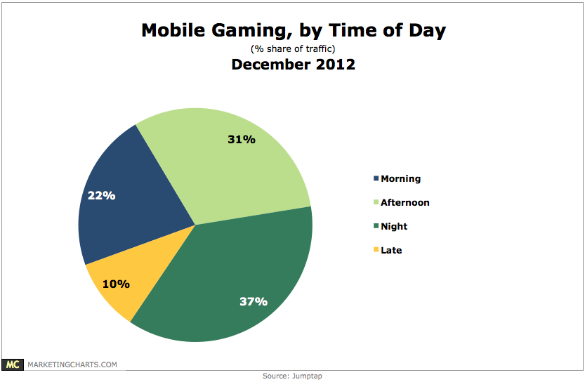
Mobile gamers place a high level of value on the experience gaming provides and they’re most likely to want to have that experience at night time.
Read MoreUS Travelers' Online Transactions By Device & Travel Category, August 2012 [CHART]

More than half of these US travelers purchased hotel reservations via laptop, while only 17% booked hotels via tablet, and 11% via smartphone.
Read MoreUS Travelers' Online Transactions By Device, August 2012 [CHART]
More than three-quarters of US travelers had purchased travel on a PC in the past six months.
Read MoreUS Mobile Advertising Spending, 2010-2016 [CHART]
eMarketer expects overall spending on mobile advertising in the US, including display, search and messaging-based ads served to mobile phones and tablets, to rise 180% this year to top $4 billion.
Read MoreMobile Content Activities, June 2012 [CHART]

Game playing topped the list of mobile content activities among US tablet owners in June 2012, with 59% of respondents having done this activity.
Read MoreDevice Dependence By Age, December 2012 [CHART]

78% of 18-29-year-old social media users are very or extremely dependent on their mobile phones.
Read More