Mobile Behavior
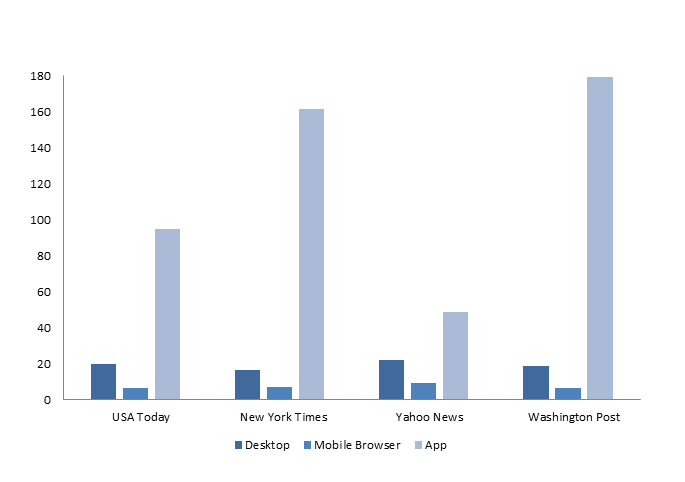
Average Minutes Visitors Spent On News Sites, Mobile vs Desktop [CHART]
By 2020, two-thirds of all online activity is expected to take place on mobile devices.
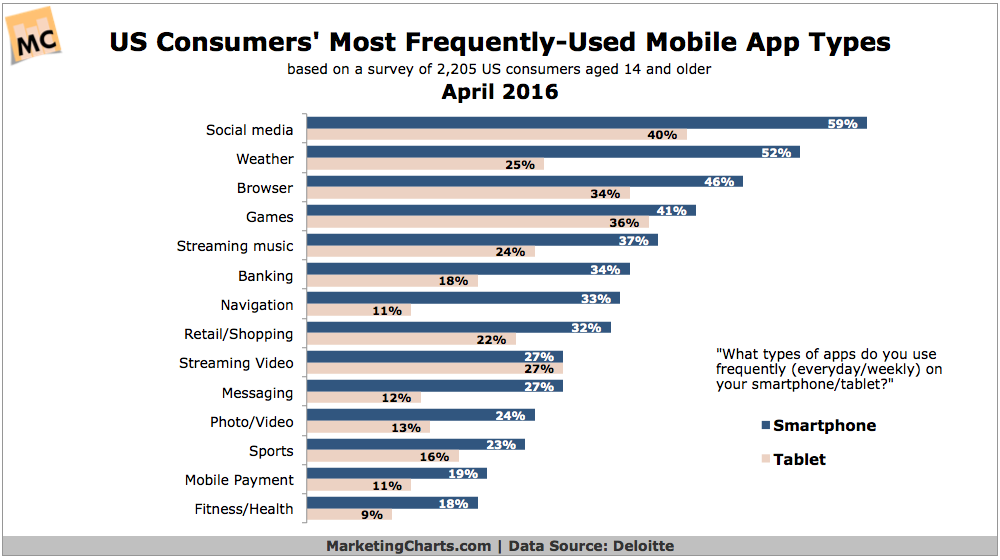
Read MoreMost Popular Mobile App Types [CHART]
Consumers aged 14 and older access apps more frequently on smartphones than tablets, with social media the top app type on both devices.
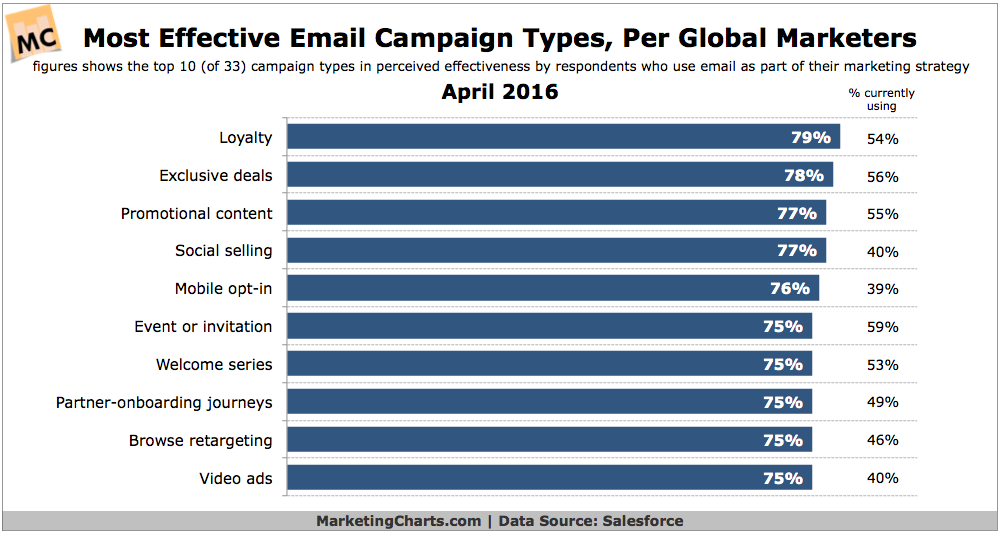
Read MoreMost Effective Types Of Email Campaigns [CHART]
The most commonly used email campaign types aren’t always the most effective.
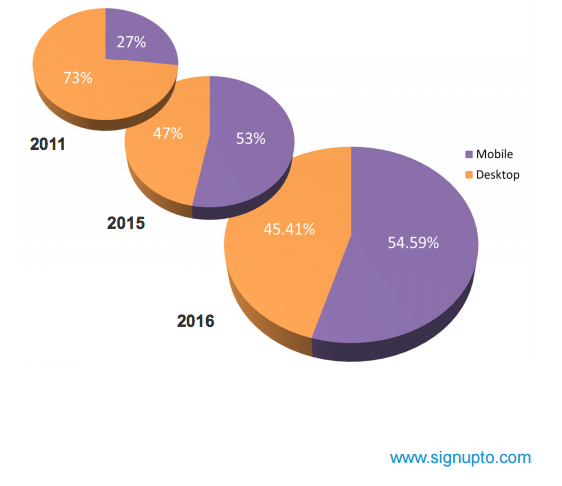
Read MoreEmail Opens By Device, 2011-2016 [CHART]
Research from Econsultancy’s 2016 email marketing benchmarks report demonstrates that people more frequently turning to their mobile devices to check email, growing from 27% in 2011 to 55% in 2016.
Read MoreSnapchat Growth, 2014-2020 [CHART]
In the battle among the social networks to attract new users, 2016 will be a banner year for Snapchat.
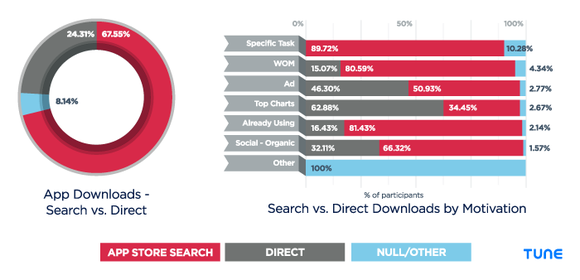
Read MoreTop New App Discovery Methods [CHART]
App store search accounts for more than 67% of actual new app discovery.
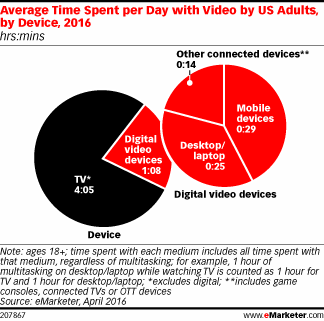
Read MoreAverage Daily Video Consumption By Device [CHART]
Even in a category as robust as digital video, though, growth has slowed and is expected to slow even more.
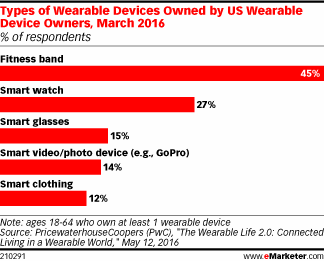
Read More5 Most Popular Wearable Devices [CHART]
This year eMarketer estimates wearables usage will grow by roughly 60%, to reach nearly 64 million people.
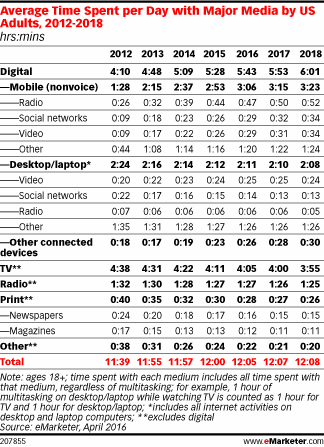
Read MoreAverage Daily Time Spent With Media, 2012-2018 [TABLE]
Thanks to media multitasking, US adults will squeeze an average of 12 hours, 5 minutes per day of media usage into their waking hours this year—nearly an hour more than the average in 2011.
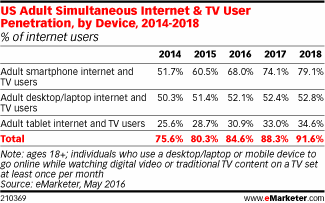
Read MoreSimultaneous Internet & TV Users, 2014-2018 [TABLE]
This year, 182.9 million Americans will use the internet while watching TV at least once a month.
Read More