Mobile Behavior
Social TV & Super Bowl XLVII [INFOGRAPHIC]
This infographic by Trendrr TV breaks down the social TV chatter that Super Bowl XLVII generated.
Read MoreHoliday In-Store Mobile Shopping Experience, February 2013 [CHART]
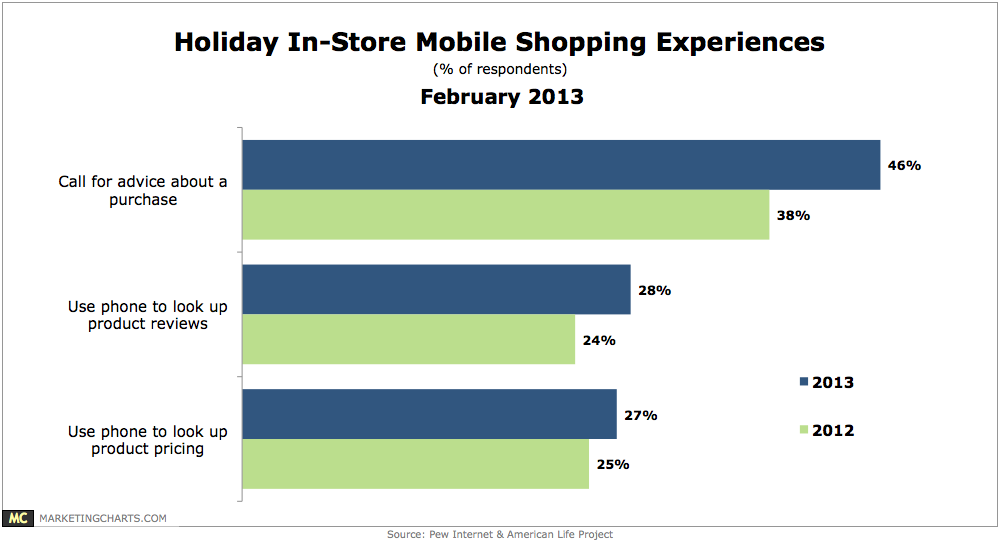
More adult mobile owners used their devices to help them shop during the 2012 holidays than during the 2011 season.
Read MoreConsumers Who Would Consider Replacing Laptop With Tablet By Demographic, 2013 [CHART]
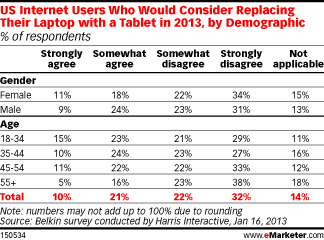
18- to 44-year-olds were significantly less likely than older people to expect to use the computer most often—in many cases citing smartphones or tablets instead.
Read MoreDevices People Use To Consume News & Entertainment By Demographic, 2013 [CHART]
In the 18- to 34-year-old demographic in particular, TV’s edge is slipping.
Read MoreMobile OS Market Share, Q3 2012 [CHART]

64% of mobile game impressions came from devices running the Android OS in Q3, while 30% came from iOS.
Read MoreTop Planned Mobile Gift Purchases, February 2013 [CHART]
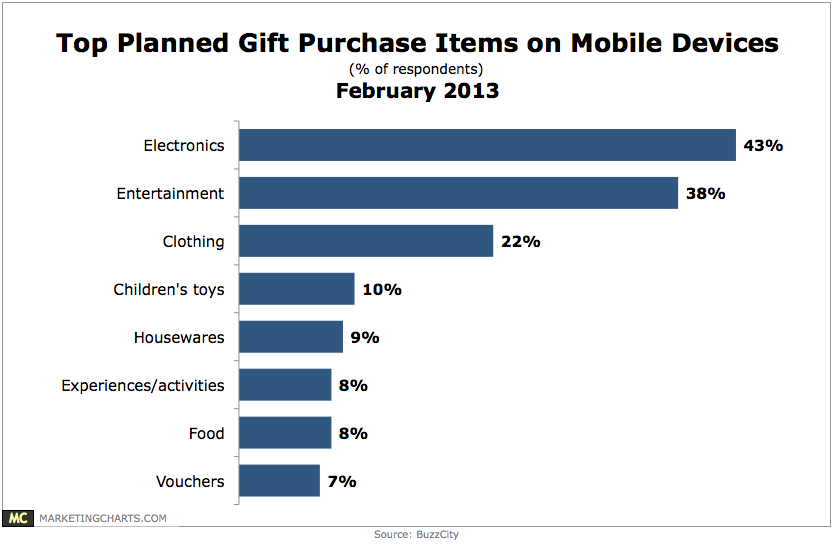
The online survey of more than 3,000 mobile users across 20 countries found that while only 27% have purchased gifts on mobiles, 29% were considering doing so.
Read MoreFacebook’s Mobile Users, Q4 2010 – Q4 2012 [CHART]
Mobile’s share of ad revenues jumped from 14% in Q3 to 23% in Q4, slightly above at least one prior estimate.
Read MoreWhere Smart Phone Owners Access The Internet, Q3 2012 [CHART]
A Q3 2012 study from Forrester found that three-quarters of smartphone internet users went online via their phone while in the car.
Read MoreAmerican Smart Phone Mobile Coupon Users, 2010-2014 [CHART]
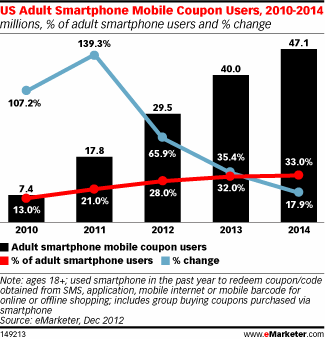
eMarketer estimates the number of smart phone coupon users last year rose by 66%, following a growth rate of more than 100% in both 2010 and 2011.
Read More