Mobile Behavior
Cost per Loyal Mobile App User Index, June 2012 – January 2013 [CHART]
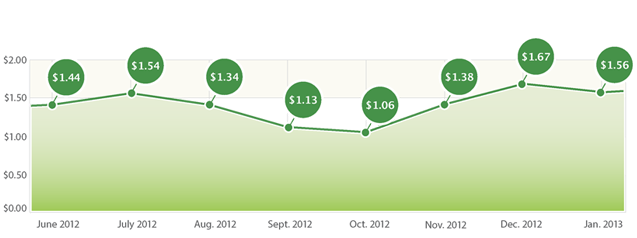
The Cost per Loyal Mobile App User Index measures the cost of acquiring a loyal user for brands who proactively market their apps.
Read MoreApp Store Competitive Index, June 2012 – January 2013 [CHART]
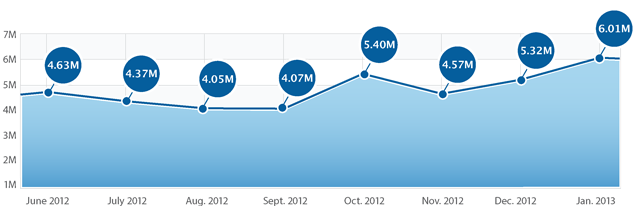
The App Store Competitive Index continued to climb by 6.01 million daily downloads, up 13 percent from December’s 5.32 million.
Read MoreFrequency With Which American Moms Use Online Channels For Health Content, January 2012 [CHART]
In January 2012 that nearly one-third of moms searched the internet for health information once a day or every few days.
Read MoreMobile Enterprise [INFOGRAPHIC]
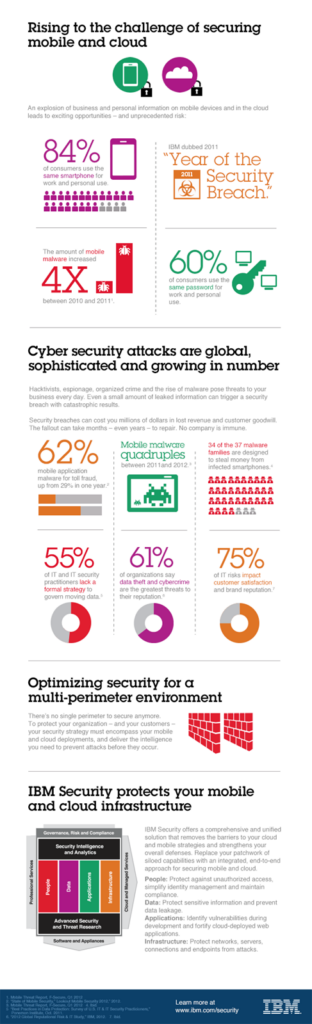
While 84% of consumers now use their personal smart phones for work, mobile malware has increased more than four times since 2010.
Read MoreTop Brand Instagram Adoption [STUDY]
With 90 million monthly active users, 40 million photos per day, and 8,500 likes per second, Instagram has now managed to attract 59% of the world’s top brands.
Read MoreConsumer Attitudes Worldwide Toward Mobile Advertising, February 2013 [CHART]
This chart from Nielsen is a snapshot of consumer attitudes worldwide toward mobile advertising.
Read MoreTime Spent On Mobile vs. PC By Website Type, April 2013 [CHART]

This graphic from comScore illustrates time spent on the Internet using a PC vs. mobile.
Read MoreHoliday Multi-Screen Shopping, 2012 [TABLE]

63% of shoppers used multiple devices to help with their holiday purchases last year.
Read MoreVideo Buffering Problems By Device, 2012 [CHART]
Almost 55% of online video views on iOS devices had a problem with buffering, compared to 50% of video views on Xbox, 49% on Android, and only 36% on PCs using Flash.
Read More