Mobile Behavior
Mobile Device Use By Activity & Device Size, February 2013 [CHART]
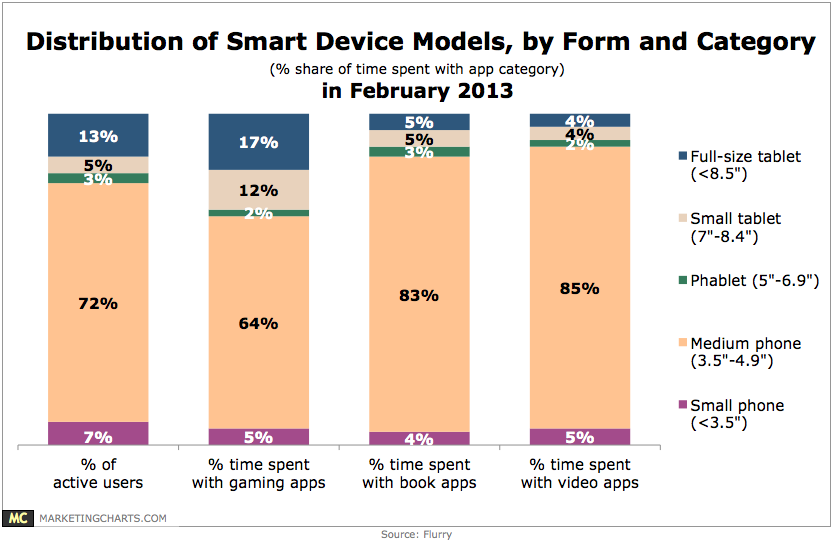
While small (5%) and full-size (13%) tablets accounted for less than 20% of active smart device users around the world, they represented 29% of time spent playing gaming applications on such devices in February 2013.
Read MoreAmerican CPG Mobile Apps, February 2013 [CHART]
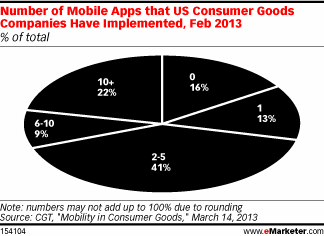
More than 80% of CPG employees said their company had at least one mobile app in use in February 2013, and nearly three-quarters had two or more apps.
Read MoreSmart Phone Use To Begin The Day, March 2013 [CHART]
89% of 18-24-year-old smart phone owners reach for their device within 15 minutes of waking up, and 74% reach for it immediately after waking up.
Read MoreWhere People Consume Text & Video Content, March 2013 [CHART]
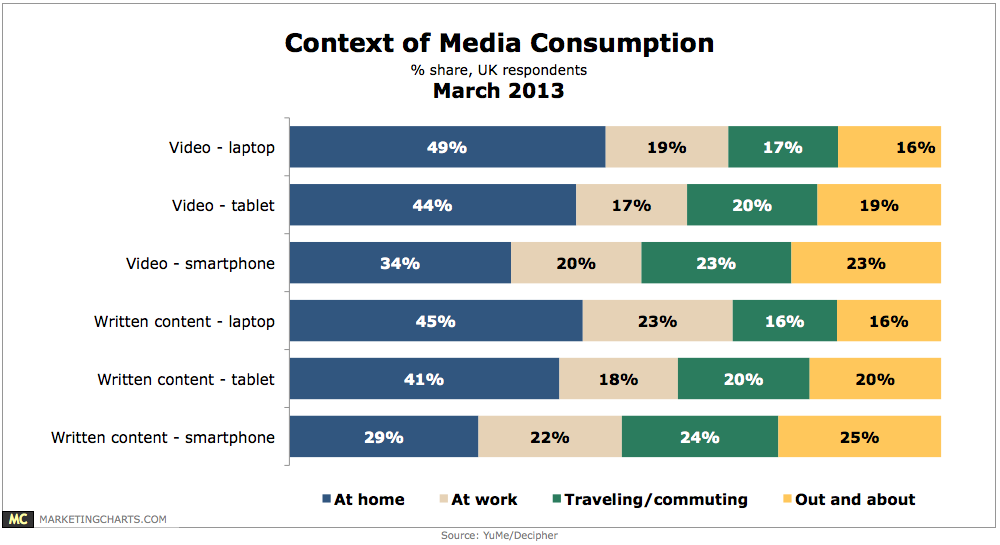
Regardless of device, consumption of videos takes place most often in the home and users are both more relaxed and explorative while at home.
Read MoreLocal Business Searches Resulting In Purchase By Device, March 2013 [CHART]
Almost 86 million people use their mobile phones to seek local business information in the US.
Read MoreNorth American Mobile Browsing By Daypart, March 2013 [CHART]
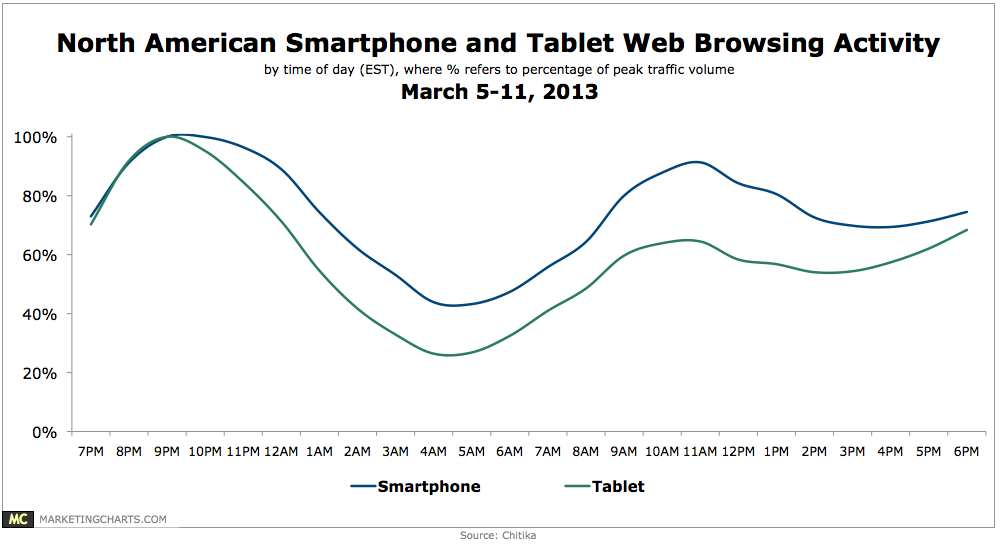
A study of web browsing by time of day shows that smart phone and tablet usage in North America peaks at 9 PM, whereas desktops reach their highest levels during the workday.
Read MoreFacebook Smart Phone Use By Weekday vs Weekend, March 2013 [CHART]
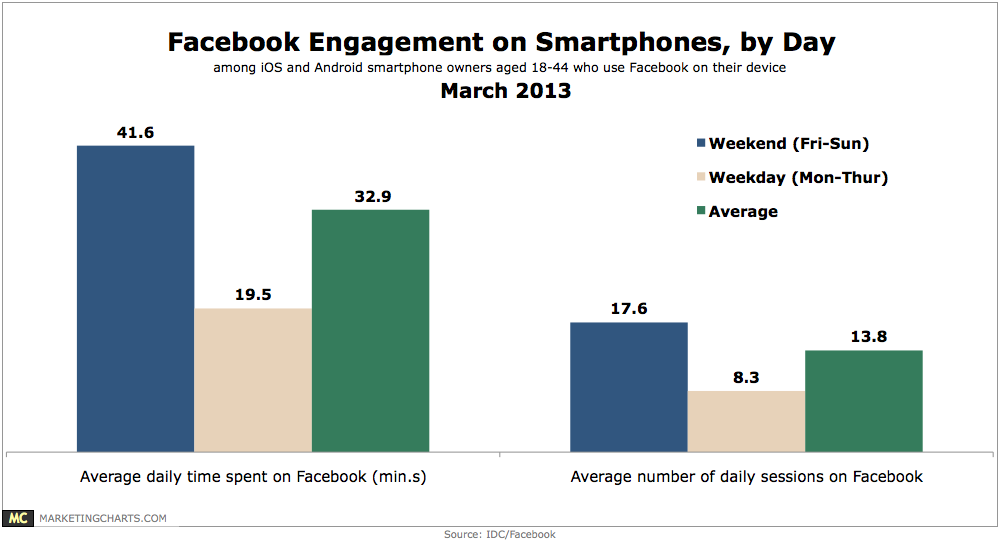
70% who use Facebook on their smart phone spend more than twice as much time doing so on the weekend (defined as Friday through Sunday) than on a typical weekday.
Read MoreNews Consumption Time By Device, March 2013 [CHART]
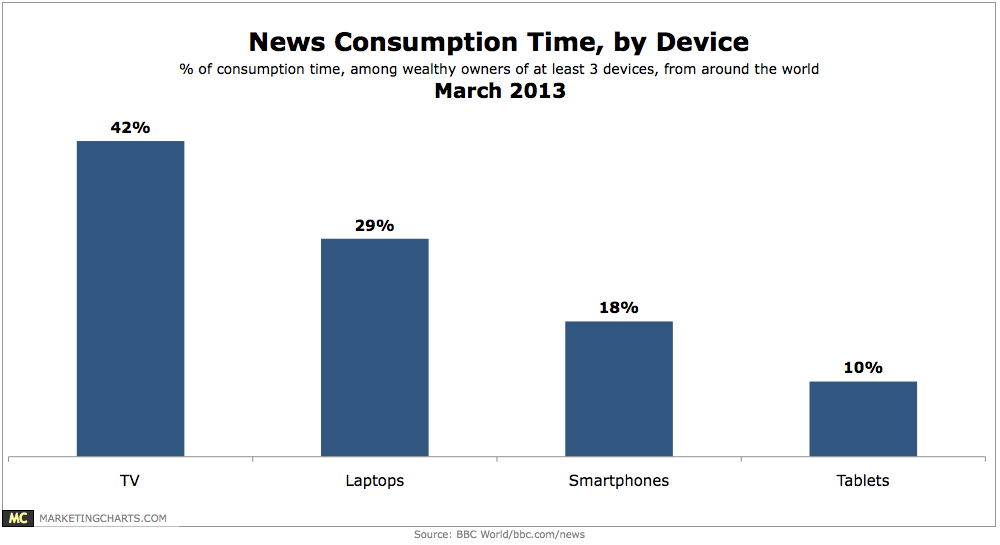
TV is still the primary device for news consumption, at 42% of respondents’ time, compared to 29% for laptops, 18% for smartphones, and 10% for tablets.
Read MoreDemographics Of Mobile Social Media App Users By Time Spent, March 2013 [CHART]
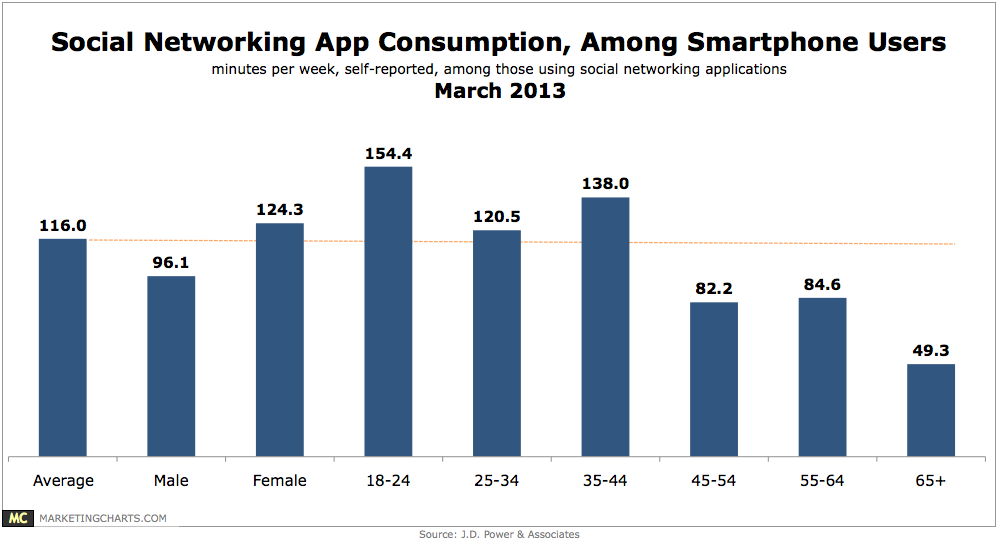
Female smart phone owners report spending a little more than 2 hours a week using downloaded social networking applications, compared to slightly more than 1-and-a-half hours for men, (124 minutes vs. 96 minutes).
Read MoreUS Mobile Search Advertising Metrics By Device, Q1 2013 [CHART]
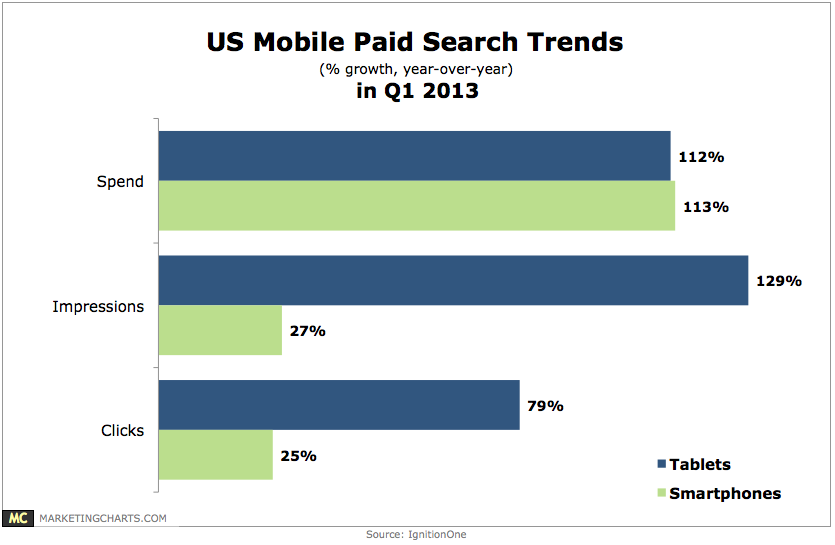
Search advertising spending on tablets increased by 113% year-over-year in Q1 2013, representing 64% of mobile search spend.
Read More