Mobile Behavior
Marketing Input Consumers Would Give For $25, April 2013 [CHART]
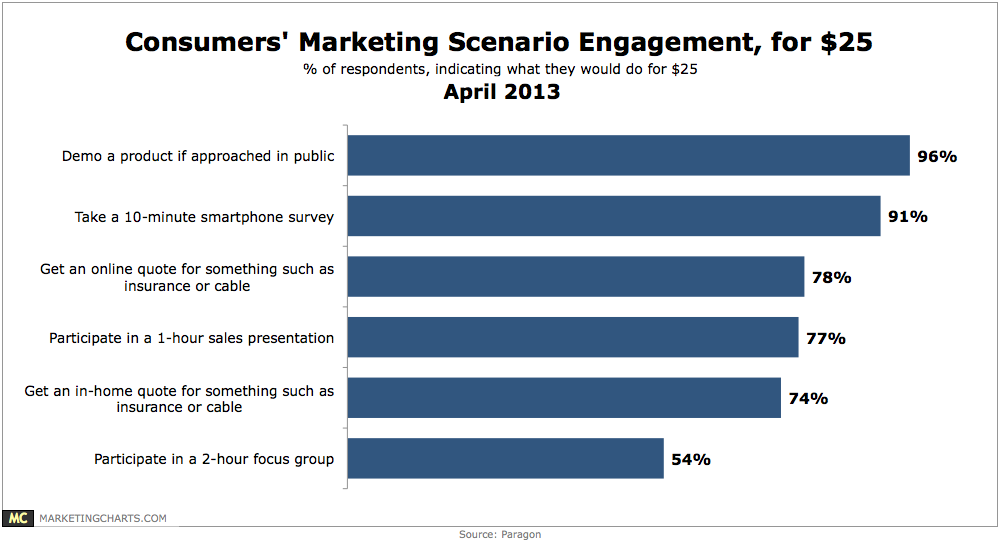
For $25, 96% of consumers would demo a product or service if approached in a public setting.
Read MoreDevices Use For Multitainment, 2012 vs 2013 [CHART]
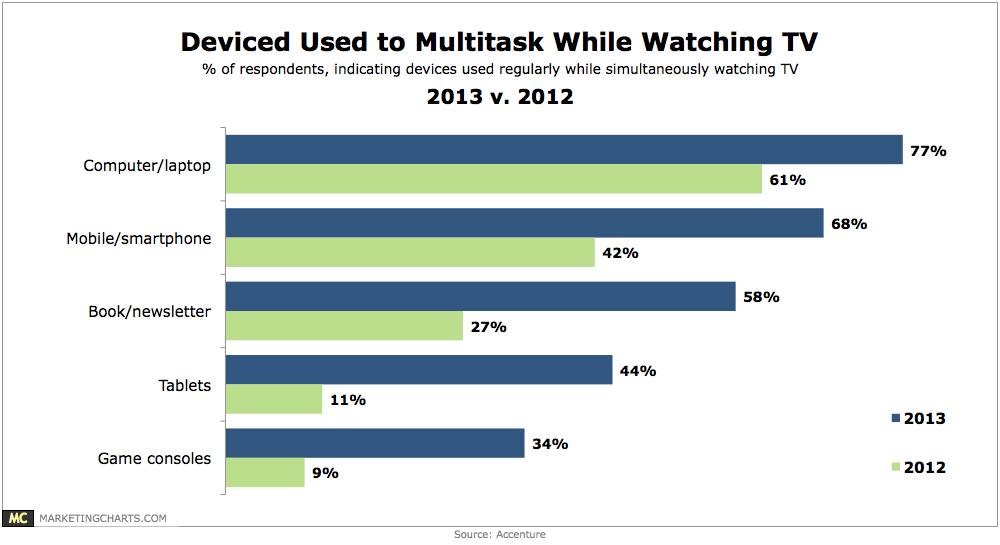
Regular use of tablets while watching TV (on a TV set) has soared from 11% in 2012 to 44% this year.
Read MoreMobile Search Behavior, April 2013 [TABLE]
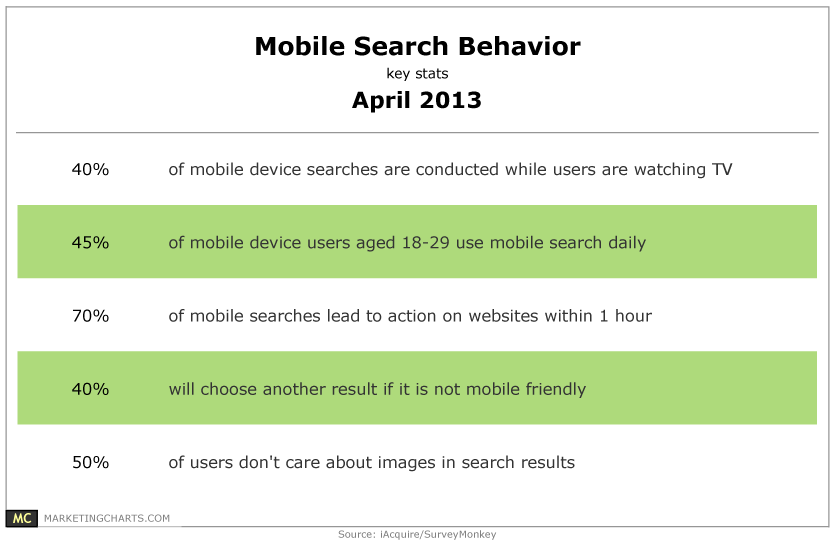
40% of mobile searches are conducted while users are watching TV.
Read MoreTop Tablet Ad Models' Performance, April 2013 [CHART]
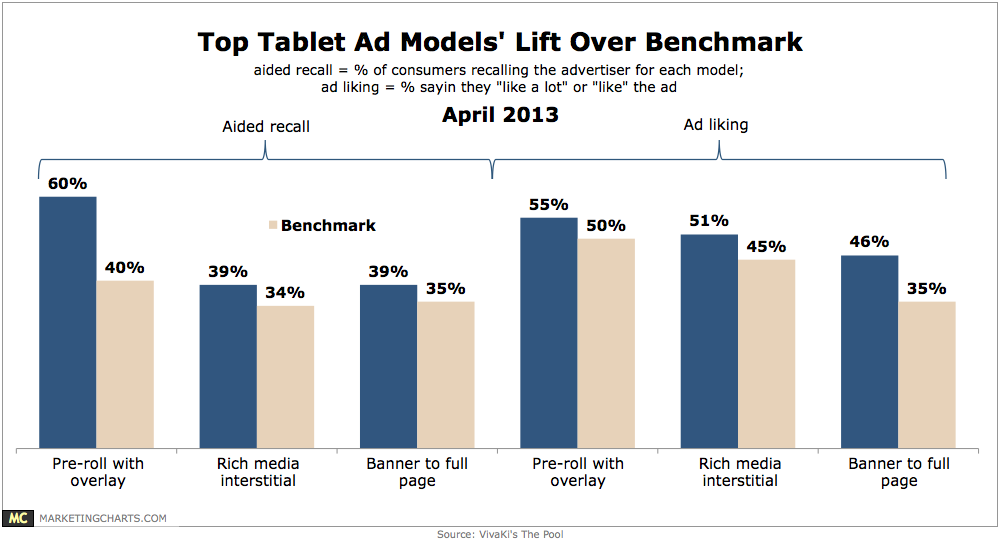
An exhaustive global study concludes that the top three tablet advertising models are pre-roll with overlay; rich media interstitial; and banner to full page rich media.
Read MoreMultiscreen Behavior With Facebook & Twitter By Gender, March 2013 [CHART]
Women were slightly more likely than men to turn to social media while watching TV, traveling and exercising, and significantly more likely to do so while shopping.
Read MoreTime Spent On iOS & Android Devices By Activity, April 2013 [CHART]
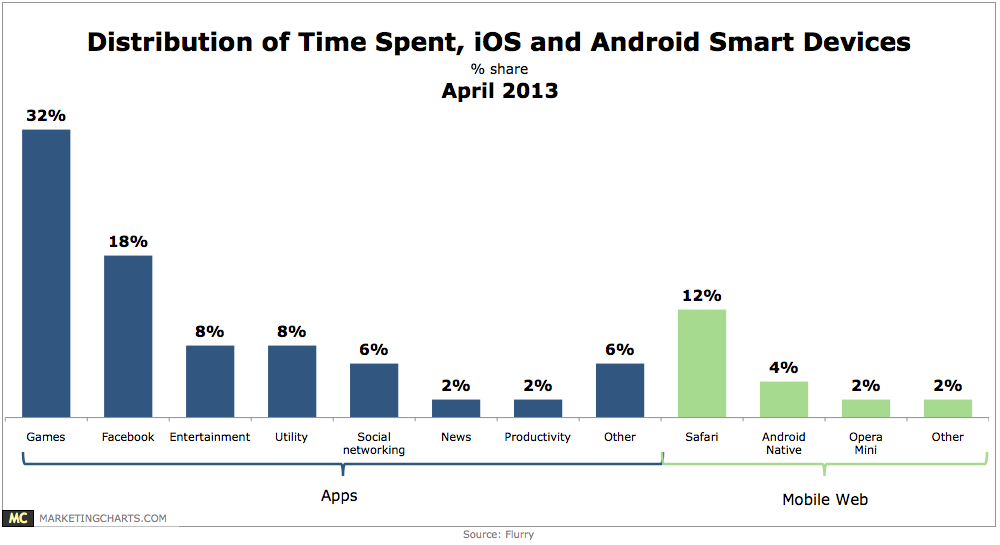
Android and iOS smart phone and tablet users spend an average of 2 hours and 38 minutes per day on their devices.
Read MoreProximity Of Mobile Phones To Their Owners, April 2013 [CHART]
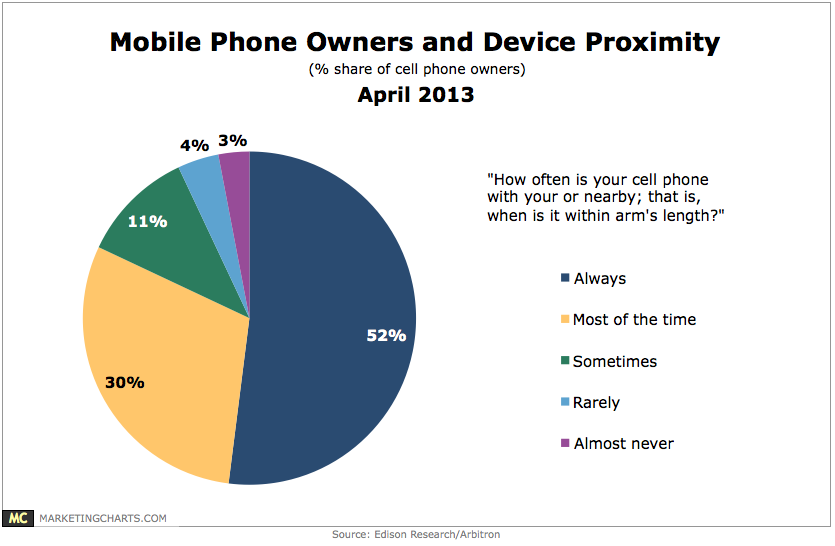
52% of mobile phone owners always keep their device within arm’s reach, and another 30% do so most of the time.
Read MoreOnline Viewership For Broadcast TV, March 2013 [TABLE]
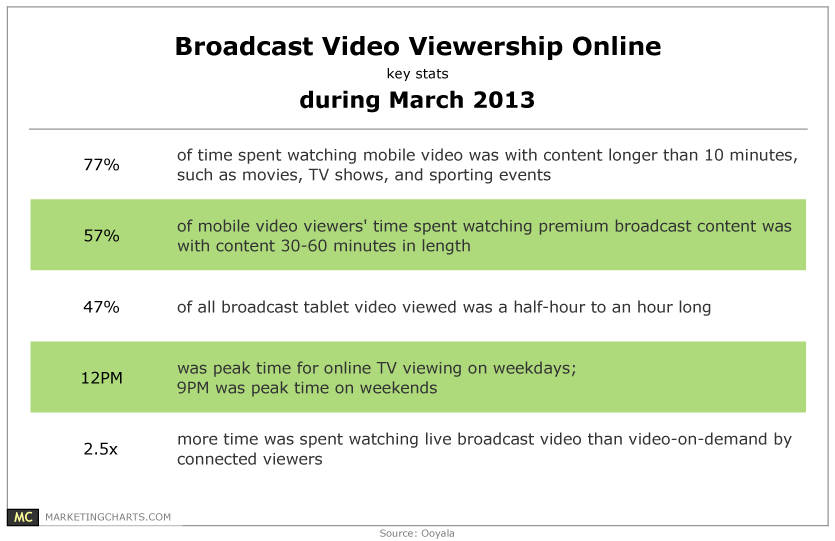
Connected viewers watched live broadcast video 2.5 times longer than video on demand (VOD), while 77% of time spent watching mobile video was with content longer than 10 minutes, such as movies, sporting events, and TV shows.
Read MoreMobile Search Behavior By Daypart [INFOGRAPHIC]
77 percent of mobile searches taking place during the study period took place at home or at work.
Read MoreAmericans' Daily Media Consumption, 2012 vs 2013 [CHART]
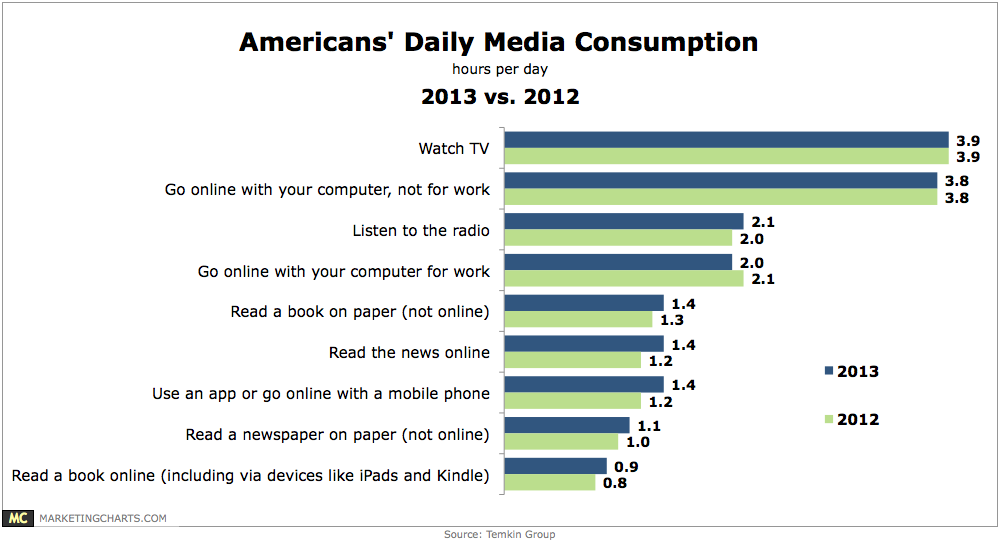
Americans are holding steady in terms of their TV consumption and non-work-related internet use, but are spending more time with other activities such as reading books and accessing the internet via a mobile device.
Read More