Mobile Behavior
Reasons For Mobile Shopping Cart Abandonment, May 2013 [CHART]

Roughly 7 in 10 smart phone and tablet owners have tried to make purchases on their device, indicating a high degree of comfort and enthusiasm with mobile commerce.
Read MoreAverage Monthly mCommerce Spending Among IYP Mobile App Users, December 2012 [CHART]
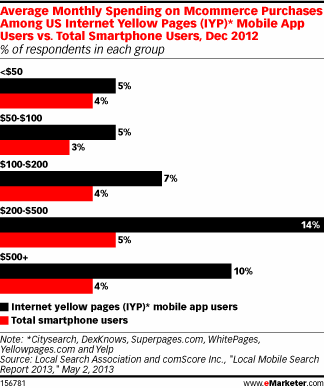
Forty-one percent of IYP app users had made a mobile purchase in December, compared with 19% of smart phone users.
Read MoreUS Internet Yellow Pages Mobile App Users By Income, December 2012 [CHART]

Internet Yellow Pages users were 51% more likely than smartphone users overall to have incomes above $100,000.
Read MoreChange In Facebook Users' Activities By Device, Q1 2013 [TABLE]
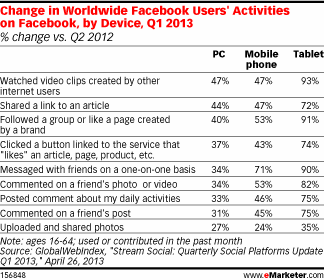
Watching videos on Facebook saw among the biggest jumps in usage, with viewing increasing by 47% on both PC and mobile, and nearly doubling on the tablet.
Read MoreAmericans' TV & Video Media Consumption By Generation, Q2 2012 [TABLE]
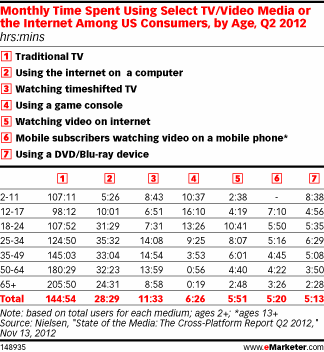
In Q2 2012, the average US mobile subscriber spent 5 hours and 20 minutes per month watching video on a mobile phone.
Read MoreBranded Vines More Likely To Be Shared Than Branded Videos [VINE]
According to a survey conducted by Unruly, branded Vines are four times more likely to be shared than branded videos and five Vine tweets are sent every second.
Read MoreSecurity Measures Not Taken By Smart Phone Owners, May 2013 [TABLE]
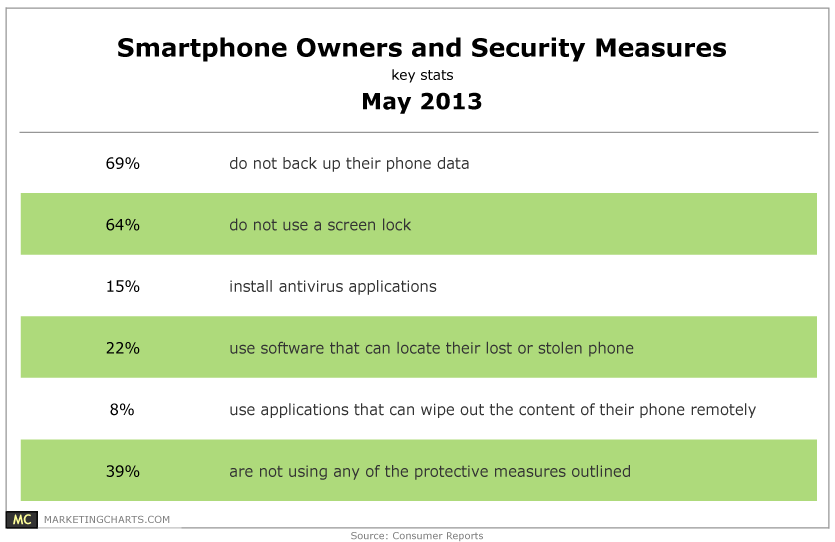
Only 22% of smart phone users have installed an application to locate a missing phone.
Read MoreMobile Devices & Local Content, May 2013 [TABLE]
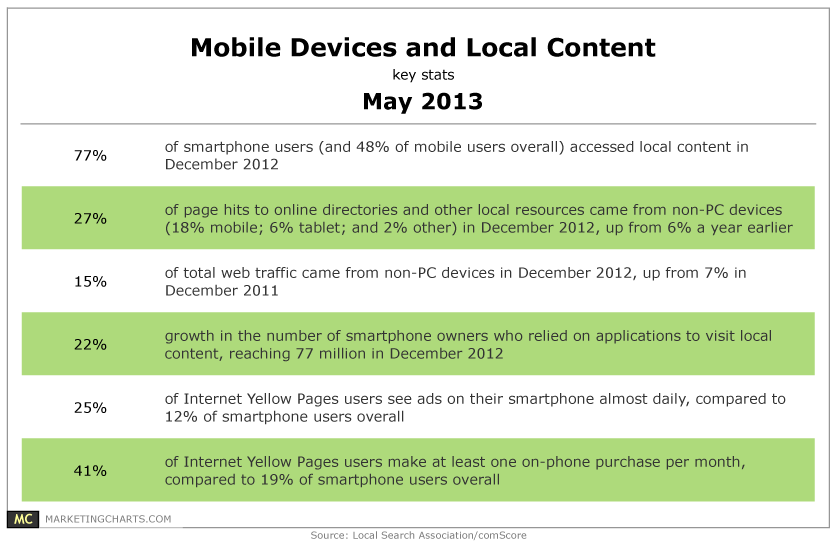
48% of mobile phone users accessed local content in December 2012, up from 42% a year earlier.
Read MoreFacebook's Mobile Monthly Active Users, Q4 2010-Q1 2013 [CHART]
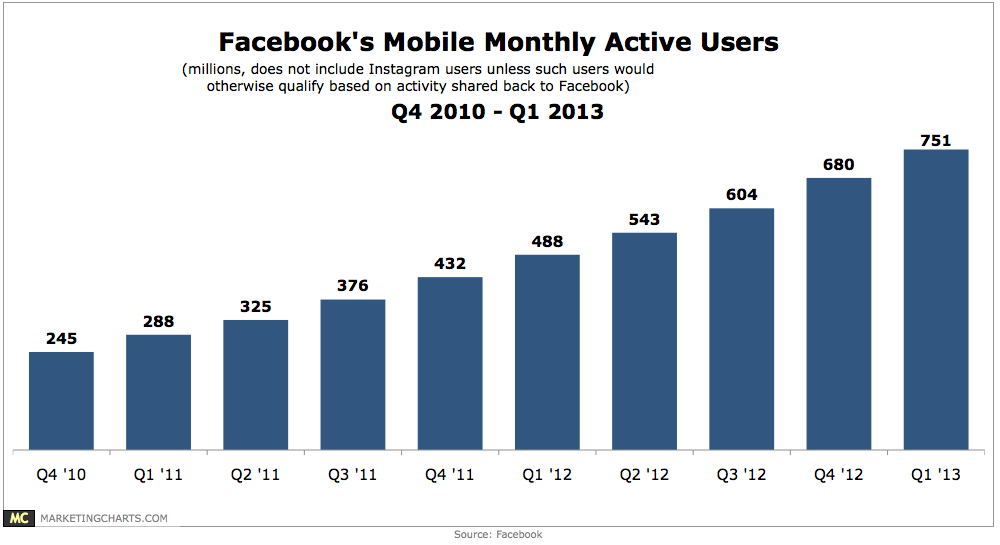
The number of mobile monthly active Facebook users grew by more than 10% quarter-over-quarter, to reach more than three-quarters of total monthly active users worldwide.
Read MoreMost Popular Gaming Devices Of Tablet Owners, May 2013 [CHART]
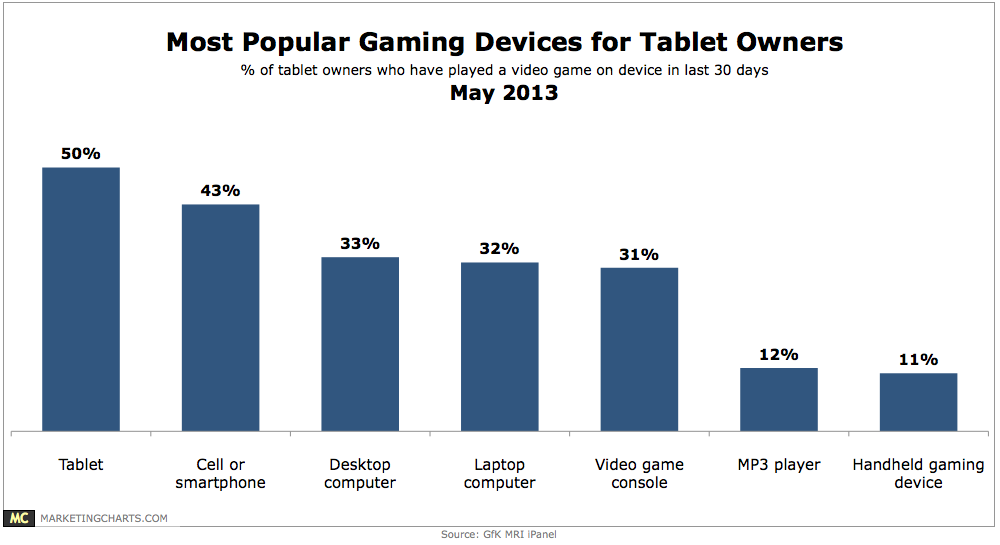
50% of tablet owners played a video game on their device in the past 30 days.
Read More