Mobile Advertising
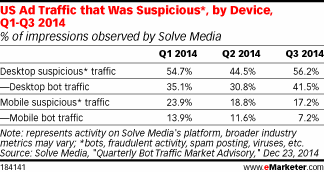
Suspicious US Ad Traffic By Device, Q1-Q3 2014 [TABLE]
The share of US desktop ad traffic that was suspicious rose nearly 12 percentage points quarter over quarter to more than half of all traffic.
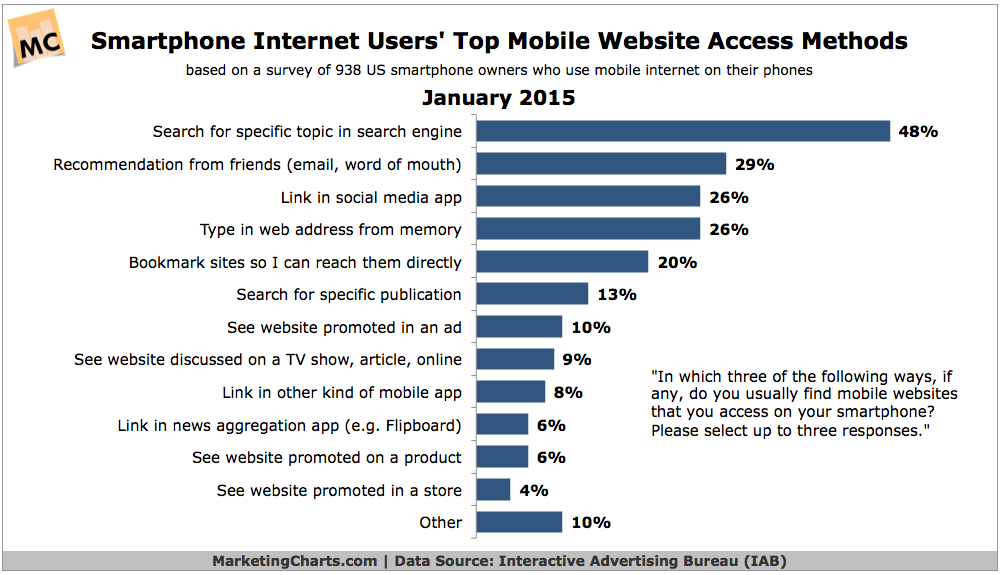
Read MoreTop Mobile Website Access Methods, January 2015 [CHART]
Mobile app consumption relative to the mobile web may be overstated.
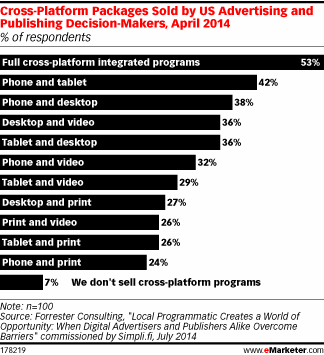
Read MoreTop Advertising Cross-Platform Packages, April 2014 [CHART]
70% of agency media professionals cited cross-device advertising as the digital advertising topic they wanted to know more about.
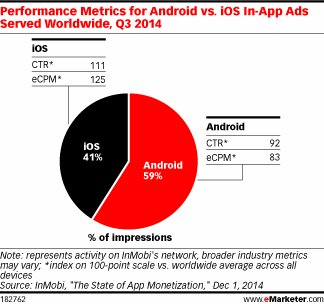
Read MoreAndroid vs iOS In-App Ad Performance, Q3 2014 [CHART]
While the overwhelming majority (85%) of in-app ad impressions took place on smartphones, tablets overindexed for average CTR and eCPM here.
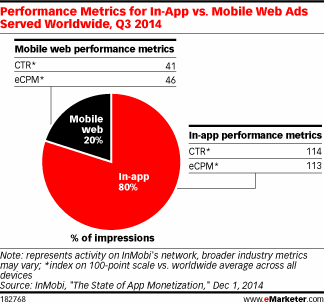
Read MoreMobile Web vs In-App Add Performance Metrics, Q3 2014 [CHART]
Mobile users are far more likely to click on ads served in an app than via mobile browser.
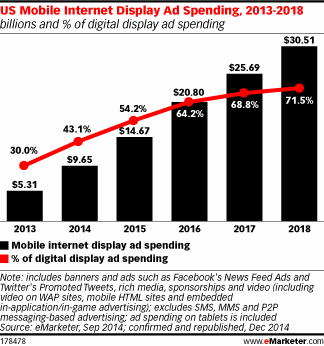
Read MoreUS Mobile Display Ad Spending, 2013-2018 [CHART]
On the whole, cost-per-thousand (CPM) averages in 2014 were on par or above 2013 rates.
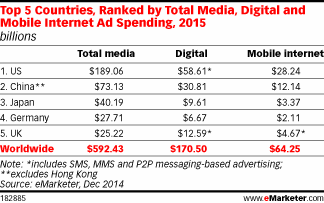
Read MoreTop 5 Countries In Ad Spending, 2015 [TABLE]
Around the world, advertisers will spend $592.43 billion in 2015, an increase of 6.0% over 2014.
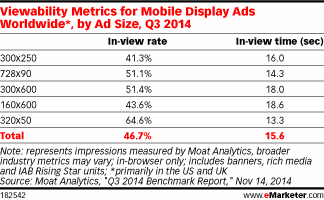
Read MoreMobile Display Ad Viewability Metrics By Ad Size, Q3 2014 [TABLE]
Screenwide display ads on mobile were tops for viewability.
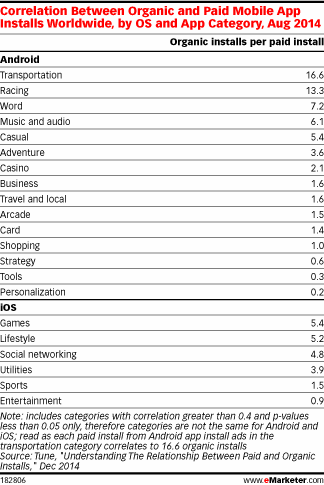
Read MoreCorrelation Between Organic & Paid Mobile App Installs, August 2014 [TABLE]
In most app categories, there is a correlation between paid app installs and organic distribution of the same apps.
Read MoreMost Influential Advertising Among Hispanic Shoppers, December 2014 [CHART]
TV, online display, and social are the advertising media most likely to influence Hispanics who shop online, almost 8 in 10 of whom are aged 18-34.
Read More