Mobile Advertising
Hispanics' Purchase Decision Influences, March 2015 [TABLE]
Hispanics are more receptive to online advertising than non-Hispanics, but also rely more on their family when making purchase decisions.
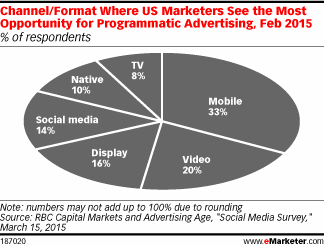
Read MoreChannel/Format Where Marketers See Most Opportunity For Programmatic Ads, February 2015 [CHART]
Mobile will see its fair share of spending increases; it ranked as the No. 1 area of opportunity for programmatic ads, cited by 33% of marketers.
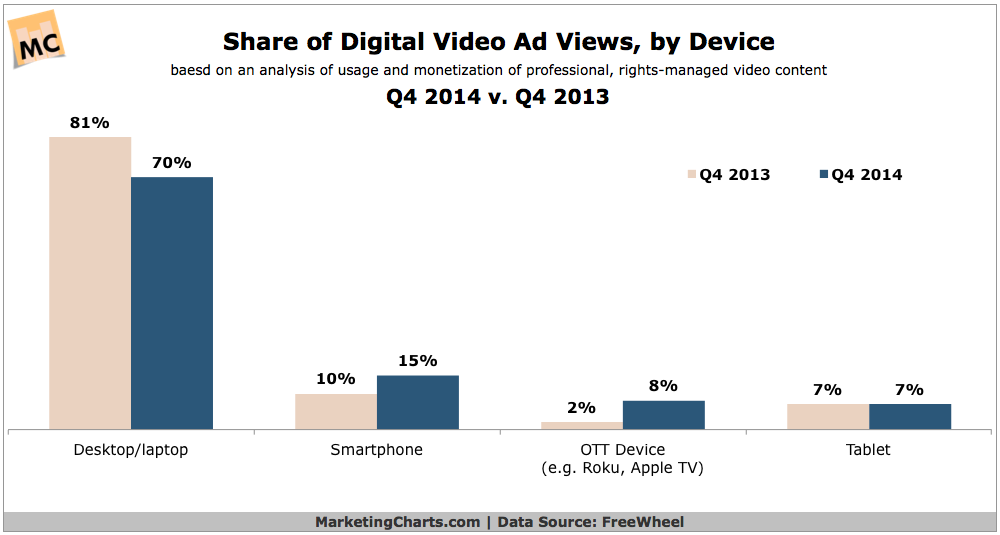
Read MoreShare Of Video Ad Views By Device, 2013 vs 2014 [CHART]
Tablets are popular devices for video viewing but OTT streaming devices such as Apple TV and Chromecast have moved ahead in digital video monetization.
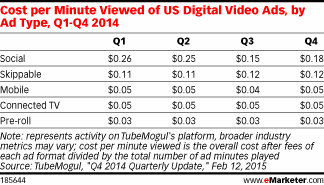
Read MoreCost Per Minute Viewed Of Video Ads, 2014 [TABLE]
The average weekly cost per minute viewed for pre-roll ads was 3.2 cents in Q4 2014—the lowest price.
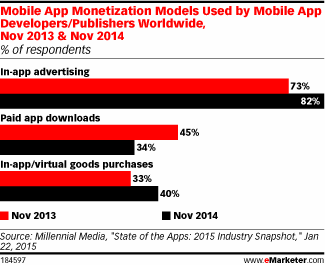
Read MoreMobile App Monetization Models, 2013 vs 2014 [CHART]
In-app advertising models grew in popularity between November 2013 and November 2014.
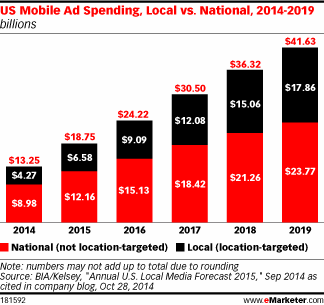
Read MoreUS Mobile Ad Spending, Local vs National, 2014-2019 [CHART]
US local ad spending via mobile is expected to soar more than 54% in 2015, from $4.27 billion to $6.58 billion.
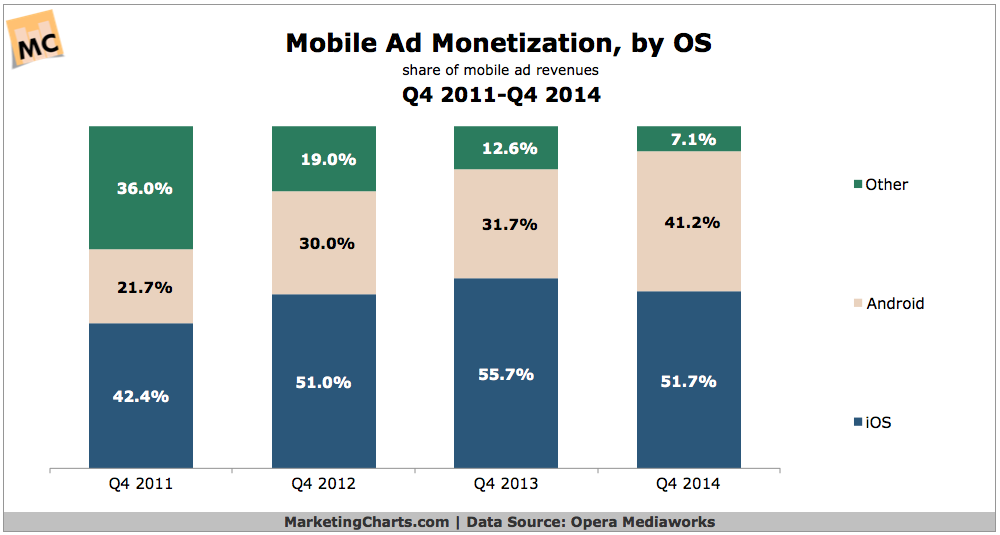
Read MoreMobile Advertising Monetization By OS, 2011-2014 [CHART]
Android is now squarely in the lead when it comes to mobile ad impressions on the Opera Mediaworks network, ending the year with 62.7% share in Q4.
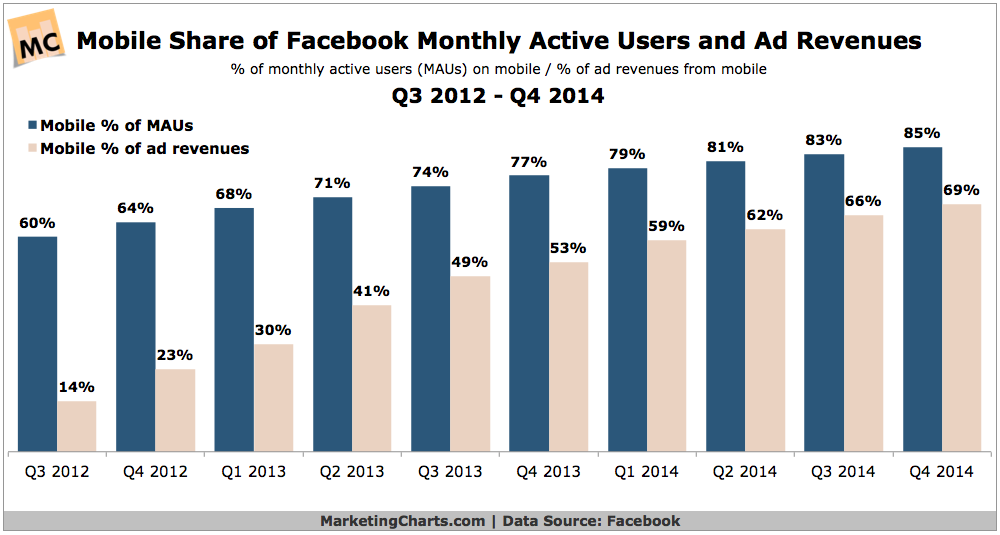
Read MoreFacebook's Mobile Active Users & Mobile Ad Revenues, 2012-2014 [CHART]
Facebook’s advertising revenues grew by 53% year-over-year in Q4 to reach almost $3.6 billion.
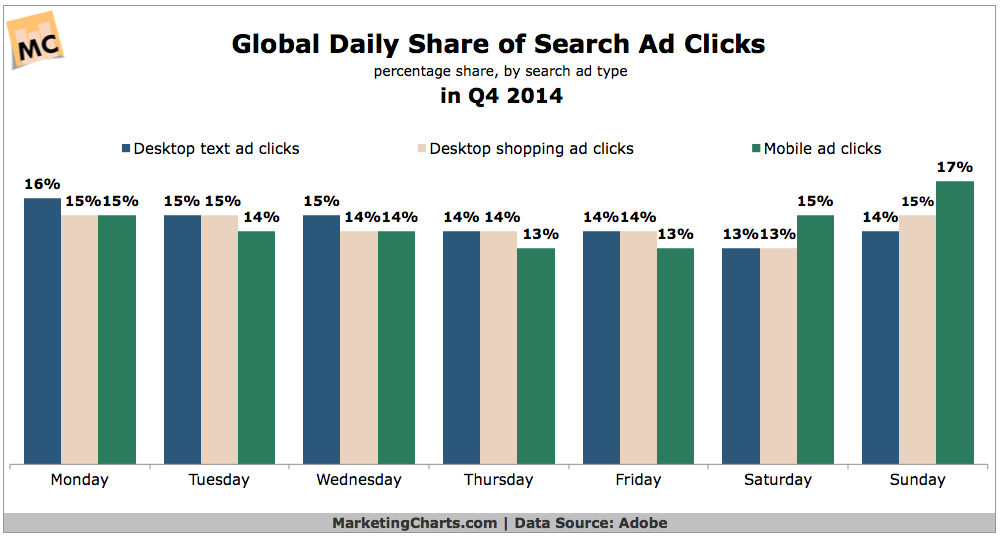
Read MoreGlobal Daily Share Of Search Ad Clicks, Q4 2014 [CHART]
Weekends tend to garner a greater share of search ad clicks on mobile devices than on desktops.
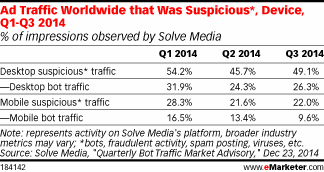
Read MoreSuspicious Global Ad Traffic By Device, Q1-Q3 2014 [TABLE]
Nearly half of desktop traffic from ads served globally was suspicious in Q3 2014, up from 45.7% in Q2 2014.
Read More
