Mobile Advertising
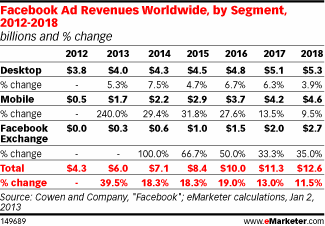
Global Facebook Ad Revenues By Segment, 2012-2018 [CHART]
Research firm Cowen and Company estimated in January that this year, Facebook’s total worldwide ad revenues would reach $6 billion, with $1.7 billion coming from mobile.
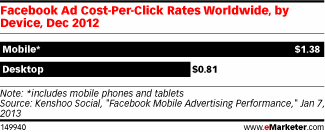
Read MoreGlobal Facebook Advertising CPC Rates By Device, December 2012 [CHART]
Cost-per-click on mobile ads was $1.38 vs. 81 cents on desktop, according to Kenshoo Social.
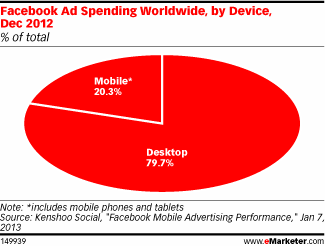
Read MoreGlobal Facebook Ad Spending By Device, December 2012 [CHART]
Already, in December 2012, one in five advertiser dollars on Facebook went to mobile.
Read MoreMobile Rich Media Ad Pricing, Q4 2012 [CHART]
Rich media ad units on its real-time bidding exchange received higher eCPMs throughout the quarter, but did not always get correspondingly higher click-through rates.
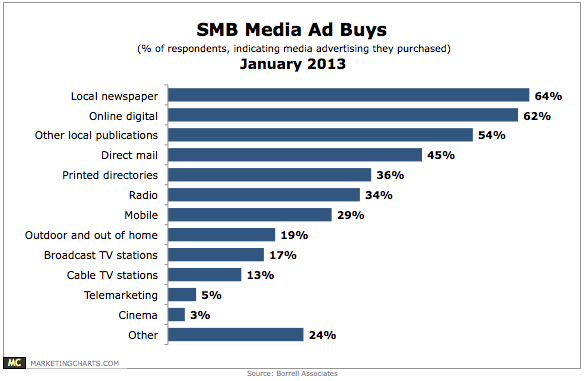
Read MoreSMB Media Ad Buys, January 2013 [CHART]
Newspaper ad expenditures have been on a steady decline for several quarters now, but SMBs still see the local paper as a valuable advertising medium.
Read MoreUS Mobile Paid Search Budgets By Tablets & Smart Phones, Q4 2012 [CHART]
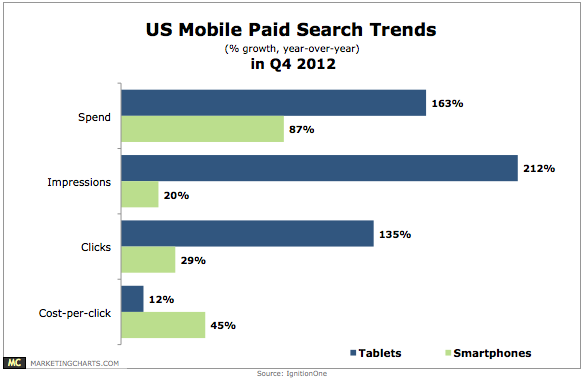
Mobile devices grew to account for 18% share of US paid search budgets in Q4 2012, from 16.3% in Q3.
Read MoreOnline & In-Store Holiday Purchase Influencers, January 2013 [CHART]
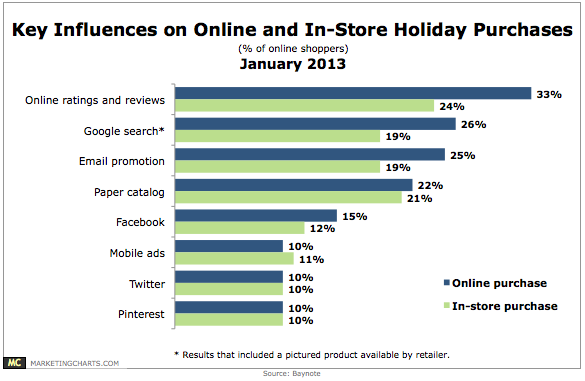
Pinterest and Twitter influenced online and in-store purchases for just 1 in 10 shoppers surveyed, with Facebook garnering only slightly more interest.
Read MoreFacebook Ad Spending By Mobile Devices, January 2013 [CHART]
Mobile devices (phones and tablets) now account for 20.3% of overall Facebook ad spending.
Read MoreGlobal Mobile Ad Spending By Region, 2011-2016 [CHART]
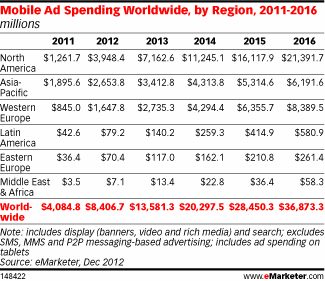
North America already has an edge on other world regions, and will widen that gap considerably by 2016.
Read MoreGlobal Mobile Ad Spending Growth By Region & Country, 2011-2016 [CHART]
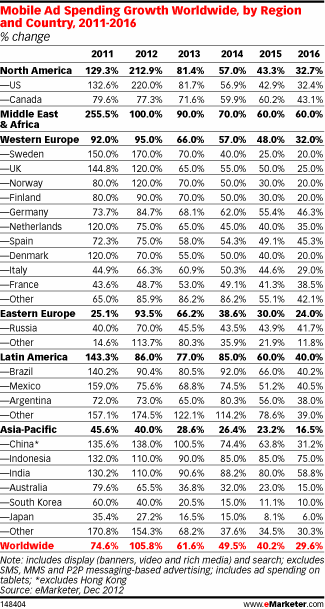
The fastest growth in 2012 came from North America, especially the US, where mobile search and display ad spending was up 220%.
Read More