Mobile Advertising
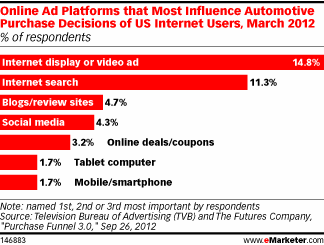
Most Influential Ad Platforms For Automotive Purchase Decisions, March 2012 [CHART]
55% of respondents’ digital ad spending went to paid search engine marketing (SEM).
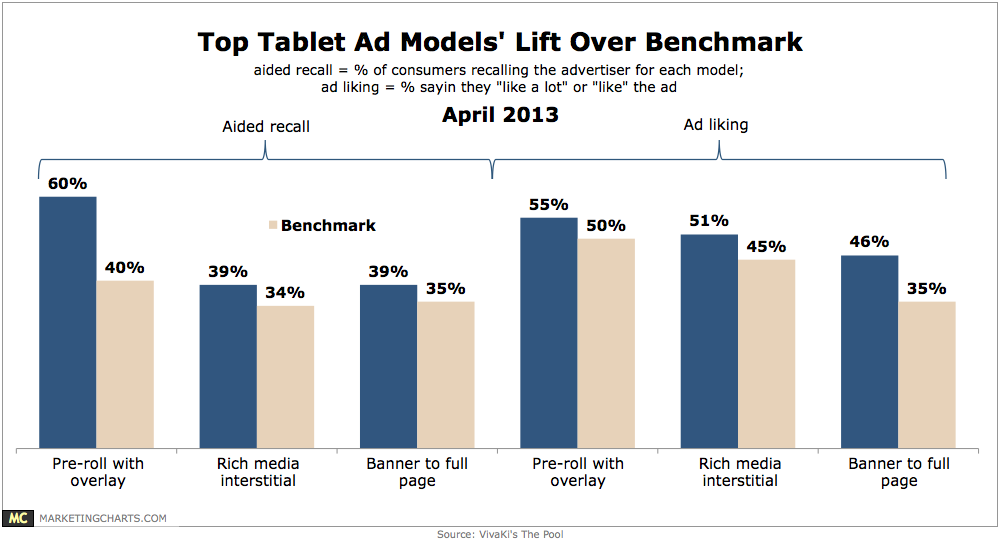
Read MoreTop Tablet Ad Models' Performance, April 2013 [CHART]
An exhaustive global study concludes that the top three tablet advertising models are pre-roll with overlay; rich media interstitial; and banner to full page rich media.
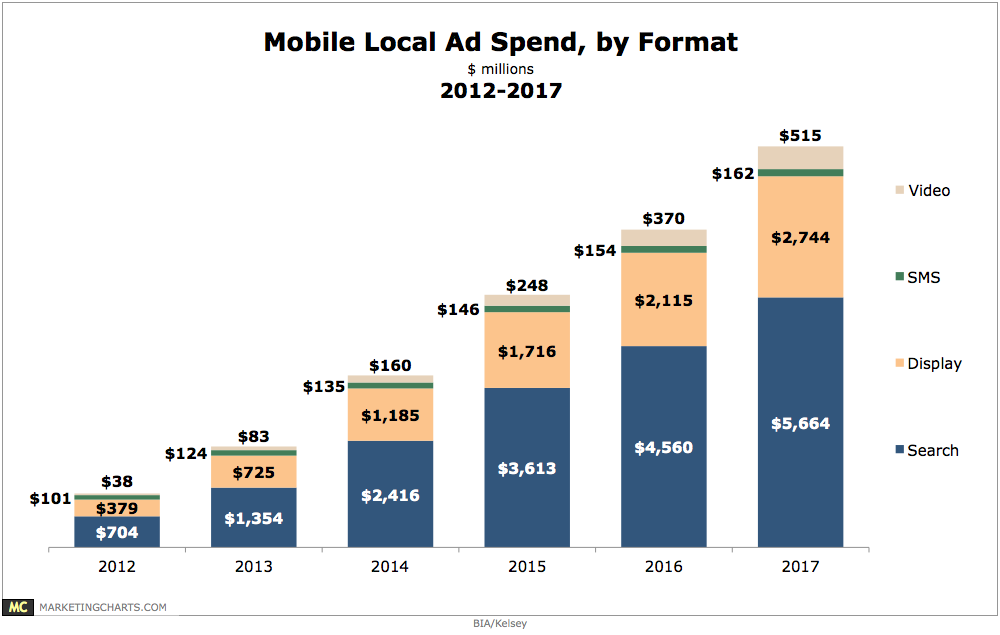
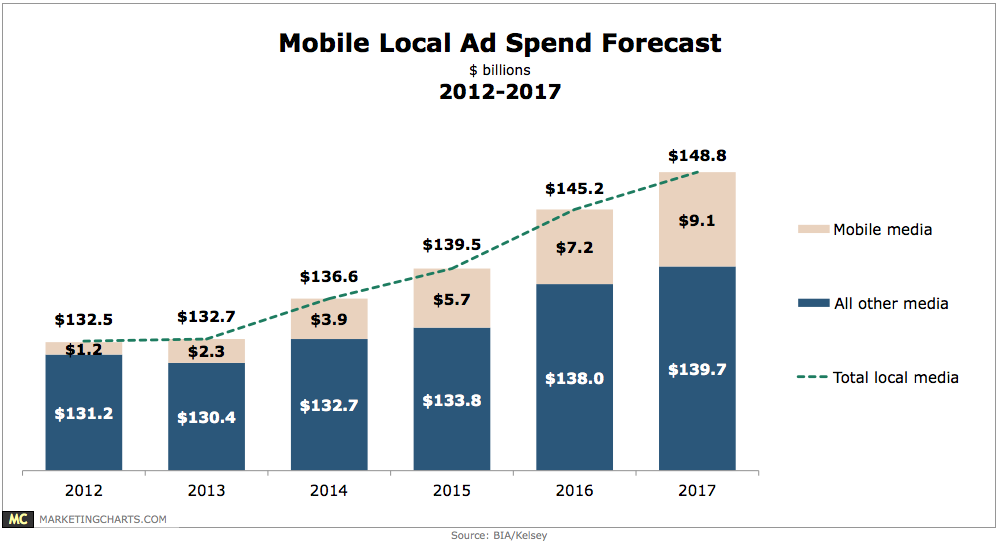
Read MoreMobile Local Ad Spending, 2012-2017 [CHART]
Increasing smart phone penetration and concurrent increases in ad inventory should spur 49.3% annual growth in local mobile ad spending through 2017.
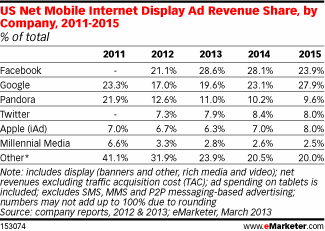
Read MoreUS Net Mobile Display Ad Revenue Share By Company, 2011-2015 [TABLE]
Facebook, the No. 2 mobile ad publisher in the country, accounted for 9.5% of mobile ad revenues in 2012 and is expected to take 13.2% this year.
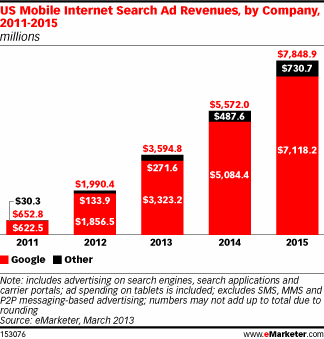
Read MoreUS Mobile Search Ad Revenues, 2011-2015 [CHART]
Google is by far the largest player with 93.3% of US net mobile search ad dollars going to the company last year.
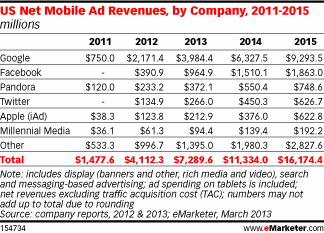
Read MoreUS Net Mobile Ad Revenues By Channel, 2011-2015
eMarketer revised its estimate for 2012 spending only slightly upward from the previous forecast in December 2012.
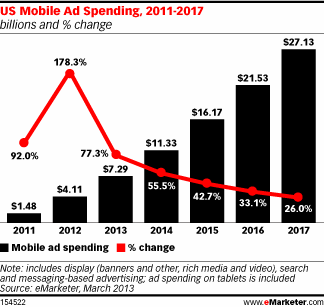
Read MoreUS Mobile Ad Spending, 2011-2017 [CHART]
US mobile advertising spending grew 178% last year to $4.11 billion.
Read MoreGrowth Of Mobile Real-Time Bidding Ads, Q1-Q4 2012 [CHART]
While less than 10% of mobile ads served were purchased via RTBs in Q1 2012, that share climbed to nearly two-thirds in Q4.
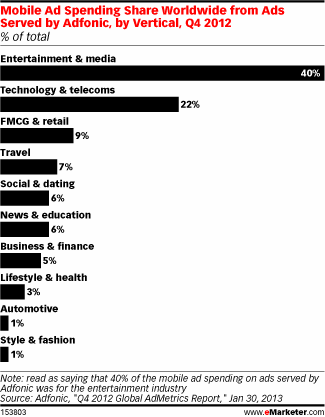
Read MoreGlobal Mobile Ad Spending Share By Vertical, Q4 2012 [CHART]
The worst performers on tablets vs. smart phones were the fast-moving consumer goods and retail industry, along with the social and dating category.
Read More