Mobile Advertising
Mobile Ad Traffic By Device, Q4 2012 vs Q1 2013 [TABLE]
Among mobile platforms, Apple’s iOS leads in monetization performance on the Opera Advertising mobile platform.
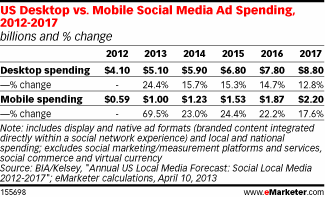
Read MoreUS Desktop vs Mobile Social Media Ad Spending, 2012-2017 [TABLE]
Mobile-social spend is expected to rise by a CAGR of 30% over the forecast period.
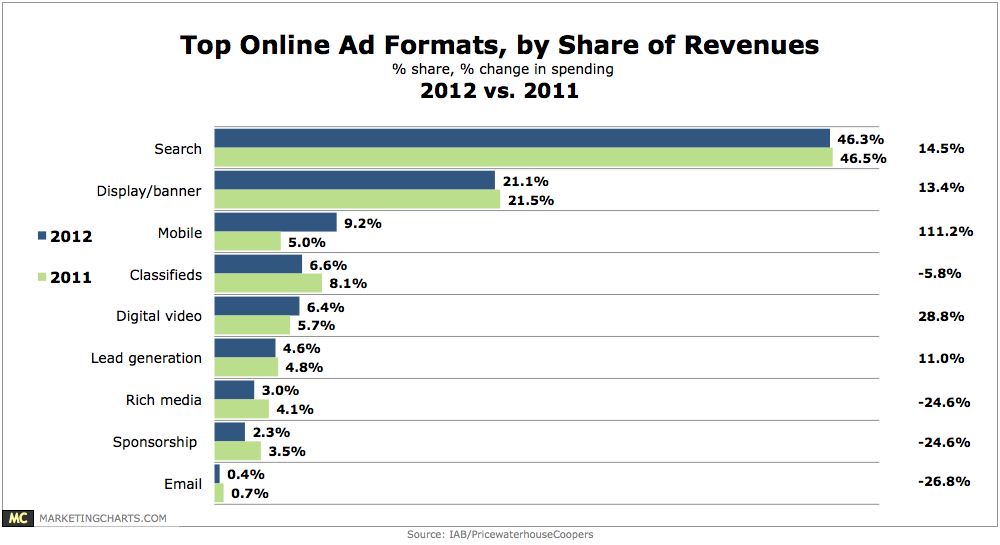
Read MoreTop Online Ad Formats By Share Of Revenue, 2011 vs 2012 [CHART]
Online ad revenues grew by 15% year-over-year in 2012.
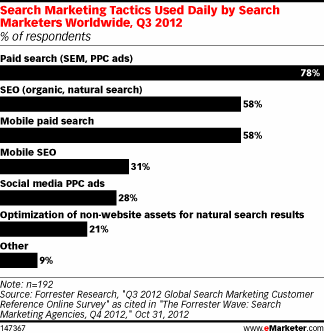
Read MoreDaily Search Marketing Tactics, Q3 2012 [CHART]
The rising tide of mobile queries brought several search engine optimization (SEO) matters to a head in 2012.
Read MoreUS Mobile Search Ad Spending, 2011-2017 [CHART]
Desktop search volume declined for the first time, while the share of queries from smart phones and tablets reached roughly 20%.
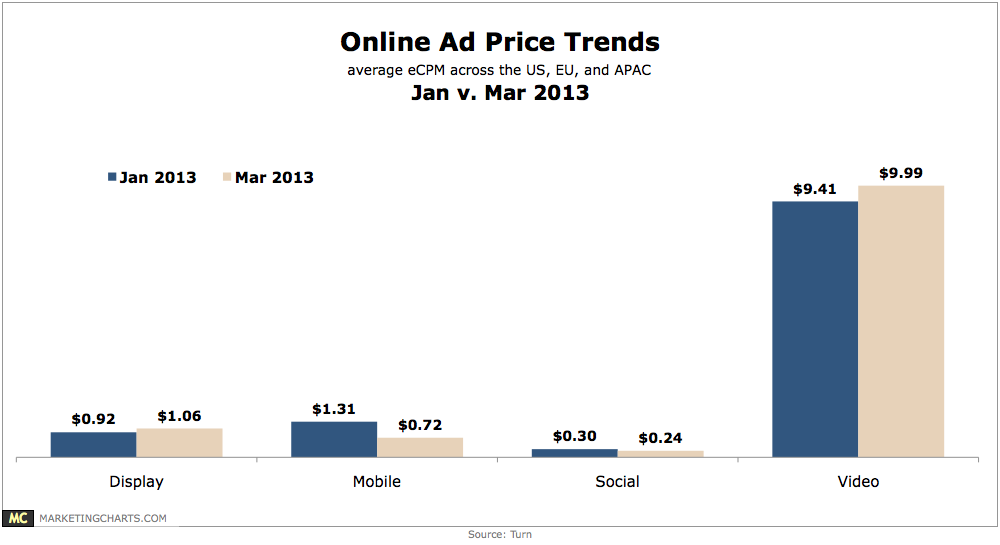
Read MoreOnline Ad Price Trends By Ad Type, January vs March 2013 [CHART]
Average video eCPMs increased 6.2% between January and March 2013, from $9.41 to $9.99, while display ad prices grew by 15.2% from $0.92 to $1.06.
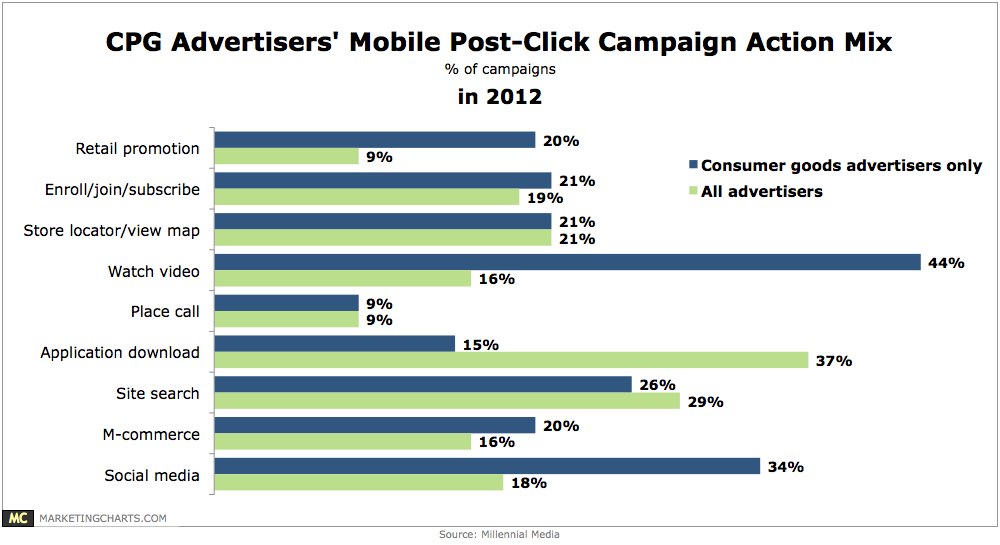
Read MoreCPG Mobile Advertising Post-Click Actions, 2012 [CHART]
CPG brands were more focused on encouraging consumers to watch video, with 44% of the campaigns incorporating a video aspect (compared to 16% on average).
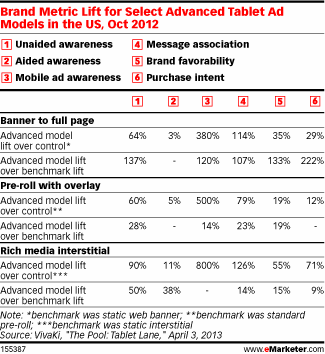
Read MoreBrand Lift Performance For Advanced Tablet Ads, October 2012 [TABLE]
The banner to full-page ad showed 380% greater mobile ad awareness over the control group who had not seen any ad.
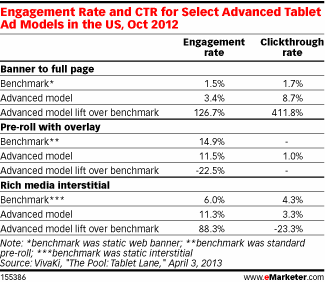
Read MoreEngagement & Click-Through Rates For Advanced Tablet Ads, October 2012 [TABLE]
At a clickthrough rate (CTR) of 8.7%, the banner to full-page ad’s clickthrough performance on tablets was more than four times greater than the static web banner.
Read MoreCompletion Rates By Length Of Mobile Rich Media Video Ads, April 2013 [CHART]
Completion rates for very short videos (less than 30 seconds) had the lowest completion rate (35.8%), behind even the longest ads (150 seconds and longer), which had a roughly 50% completion rate.
Read More
