Mobile Advertising
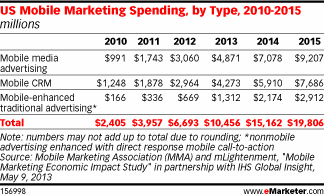
US Mobile Marketing Spending By Type, 2010-2015 [TABLE]
This year spending on mobile marketing will reach $10.46 billion. By 2015, spending on the channel will approach $20 billion.
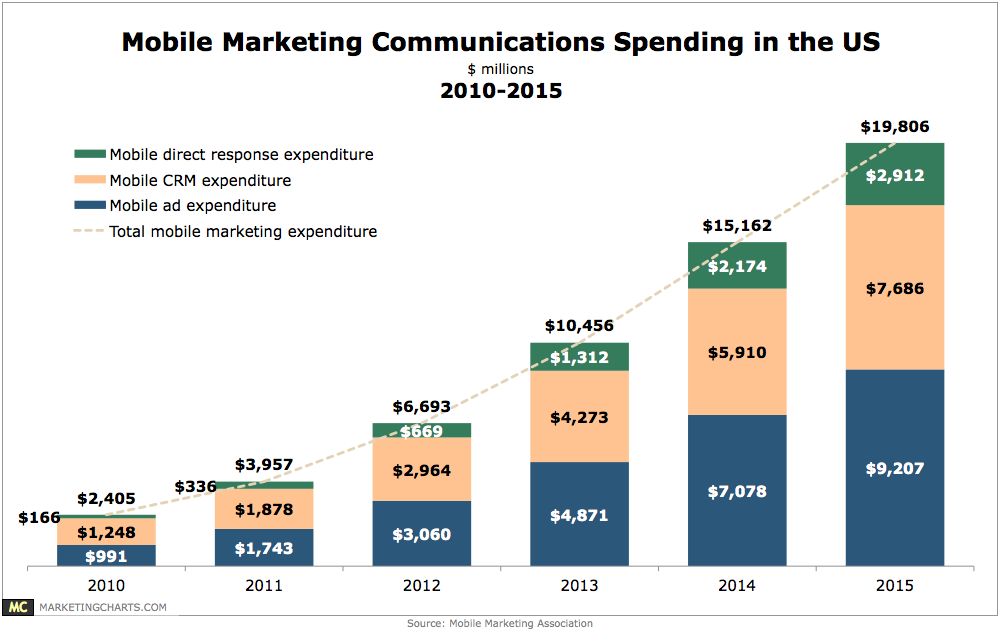
Read MoreAmerican Mobile Marketing Spending, 2010-2015 [CHART]
The mobile marketing ecosystem is demonstrating rapid growth, with $6.7 billion spent by client-side marketers and retailers in 2012.
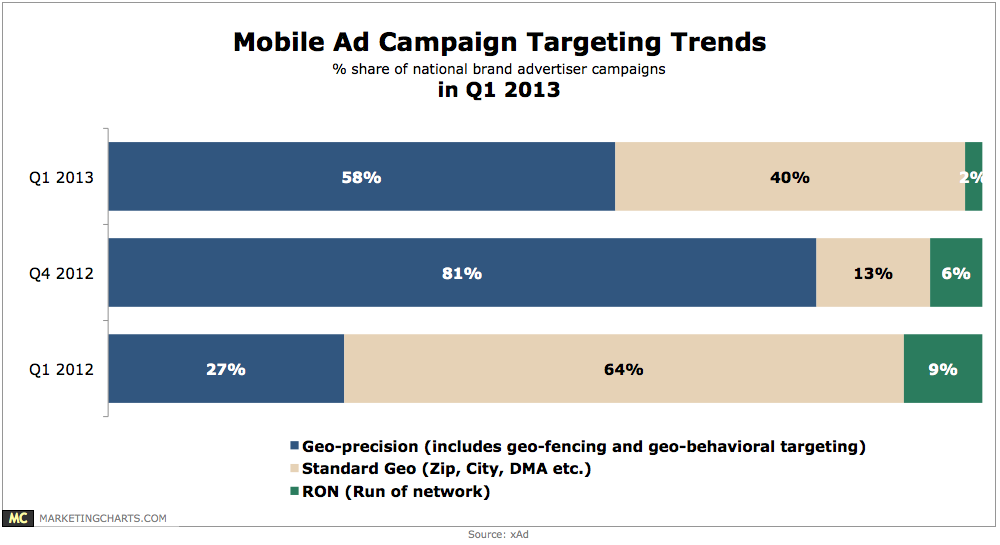
Read MoreMobile Advertising Targeting Trends, Q1 2013 [CHART]
58% of national brand advertising campaigns employed geo-precise targeting (including geo-fencing and geo-behavioral targeting) in Q1.
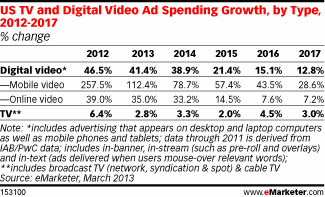
Read MoreUS TV & Digital Video Ad Spending Growth By Type, 2012-2017 [TABLE]
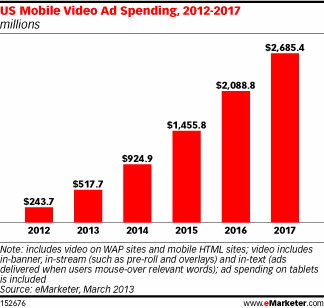
Growth rates for mobile video ad spending will be far greater than for any other related channel—television, online or total digital.
Read MoreUS Mobile Video Ad Spending, 2012-2017 [CHART]
The number of smart phone video viewers in 2014 is expected to hit nearly 87 million, or more than one-quarter of the total US population.
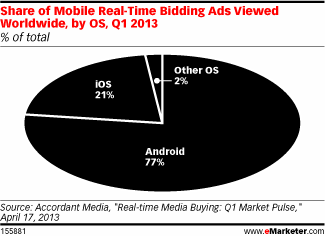
Read MoreGlobal Share of Mobile Real-Time Bidding Ad Views By OS, Q1 2013 [CHART]
In-app advertising accounted for the bulk of mobile RTB ads, at 93% of ads viewed. Browsers accounted for the remaining 7%.
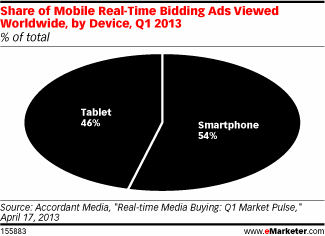
Read MoreGlobal Share of Mobile Real-Time Bidding Ad Views By Device, Q1 2013 [CHART]
In Q1 2013 that tablets accounted for 46% of mobile RTB ads viewed worldwide, compared with 54% viewed on smart phones.
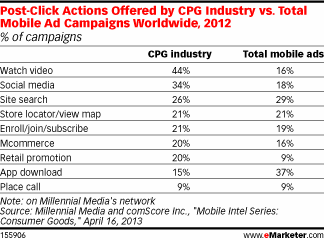
Read MoreCPG Mobile Ad Post-Click Actions, 2012 [TABLE]
44% of CPG advertisers implemented video as a post-click campaign action, compared with only 16% of all advertisers.
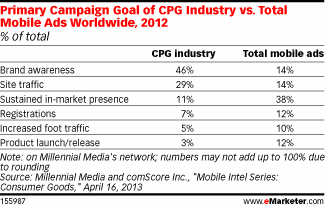
Read MorePrimary Goals Of CPG Mobile Advertising, 2012 [TABLE]
When compared with all advertisers, 46% of consumer goods campaigns worldwide in 2012 focused on brand awareness.
Read MoreMonthly Average CTR For Q1 2013 By Mobile Device [CHART]
Advertisers devoted roughly three-quarters of their budgets to iOS devices during Q1 2013.
Read More