Mobile Advertising
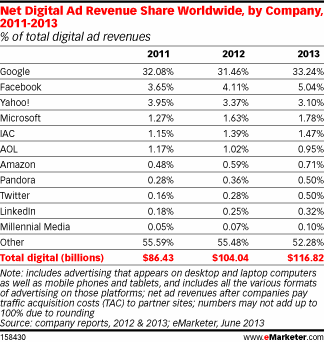
Global Online Ad Revenue Share By Company, 2011-2013 [TABLE]
Google continues to reign as not only the largest beneficiary of digital ad spending in the US, but worldwide as well.
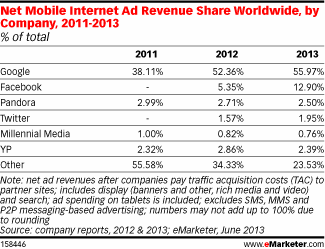
Read MoreGlobal Mobile Ad Revenue Share By Company, 2011-2013 [TABLE]
Twitter is also expected to see its worldwide mobile ad spending share increase this year to about 2% of the total, eMarketer estimates.
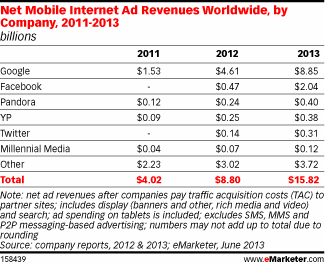
Read MoreGlobal Mobile Ad Revenues By Company, 2011-2013 [TABLE]
eMarketer estimates that Google made $4.61 billion in mobile internet ad revenues last year, more than triple its earnings in 2011.
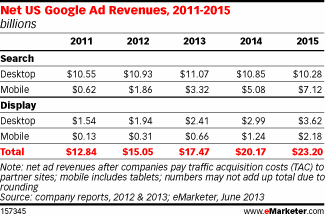
Read MoreUS Google Net Ad Revenues, 2011-2015 [TABLE]
Mobile’s rapid expansion will help that channel rival the desktop in both search and display revenues for Google by 2015.
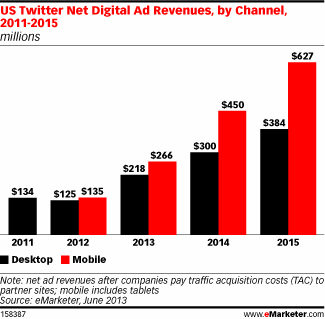
Read MoreUS Twitter Net Ad Revenues, 2011-2015 [CHART]
As of 2012, eMarketer estimates, 52% of Twitter’s net US ad revenues were from mobile; by 2015, the share will approach two-thirds.
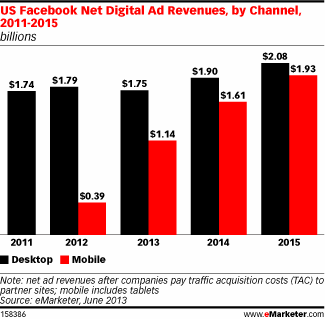
Read MoreUS Facebook Net Ad Revenues, 2011-2015 [CHART]
eMarketer estimates that after less than a full year selling mobile ads, 18% of US net Facebook ad revenues came from mobile in 2012.
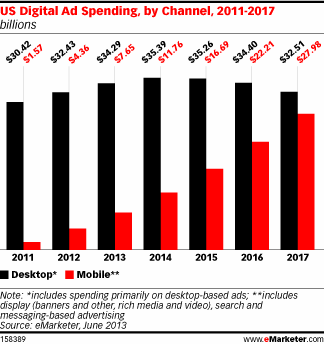
Read MoreUS Digital Ad Spending By Channel, 2011-2017 [CHART]
Desktop ad spending will peak in 2014 at $35.39 billion, up from this year’s projected total of $34.29 billion.
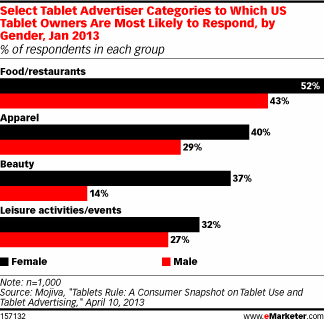
Read MoreTablet Ad Categories To Which Users Are Most Likely To Respond By Gender, January 2013 [CHART]
The content that beauty consumers devour in magazines are ripe for the interactive opportunities that tablets can provide.
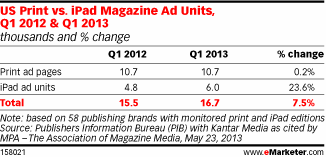
Read MoreUS Print vs. iPad Magazine Ad Units, Q1 2012 & Q1 2013 [TABLE]
The number of ad units available on just the iPad increased nearly 24%, giving the iPad editions 56% of the total number of ad units as on print pages.
Read More