Mobile Advertising
US Mobile Search Advertising Growth By Metric & Device, Q2 2013 [CHART]
US mobile paid search spend more than doubled year over year on both smart phones and tablets. By comparison, total search spend was up only 7% over Q2 2012.
Read MoreHow US Technology Consumers Respond To Mobile Ads, 2012 [CHART]
Tablet owners in 2012 to be far more likely than smart phones owners to click on ads, and also to research or purchase a product after seeing an ad.
Read MoreUS Mobile Search Advertising Trends, Q2 2013 [CHART]
There doesn’t seem to be any slowdown in mobile search ad spending, which has doubled on a year-over-year basis for several quarters now.
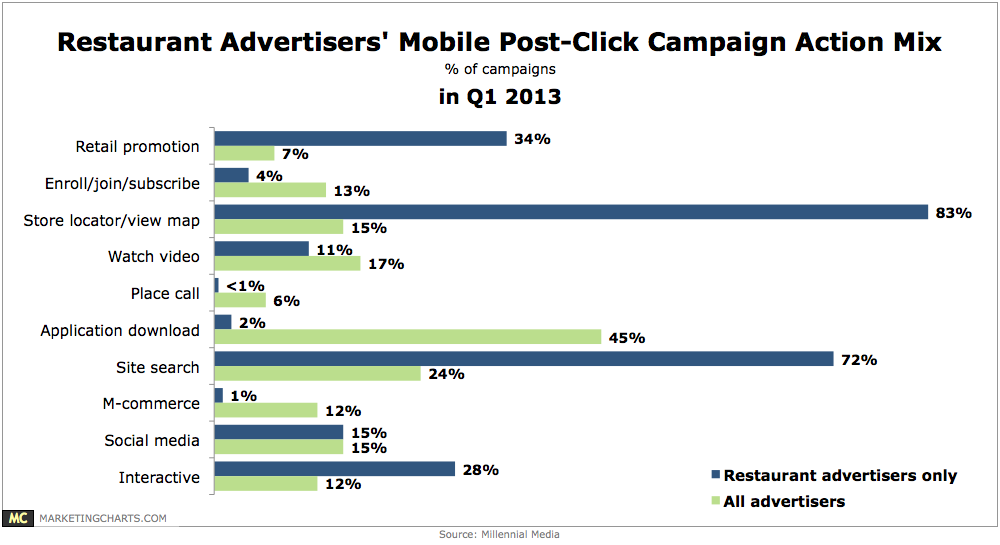
Read MoreRestaurant Mobile Advertising Tactics, Q1 2013 [CHART]
Restaurants’ mobile advertising campaigns are overwhelmingly focused on driving foot traffic, reveals Millennial Media.
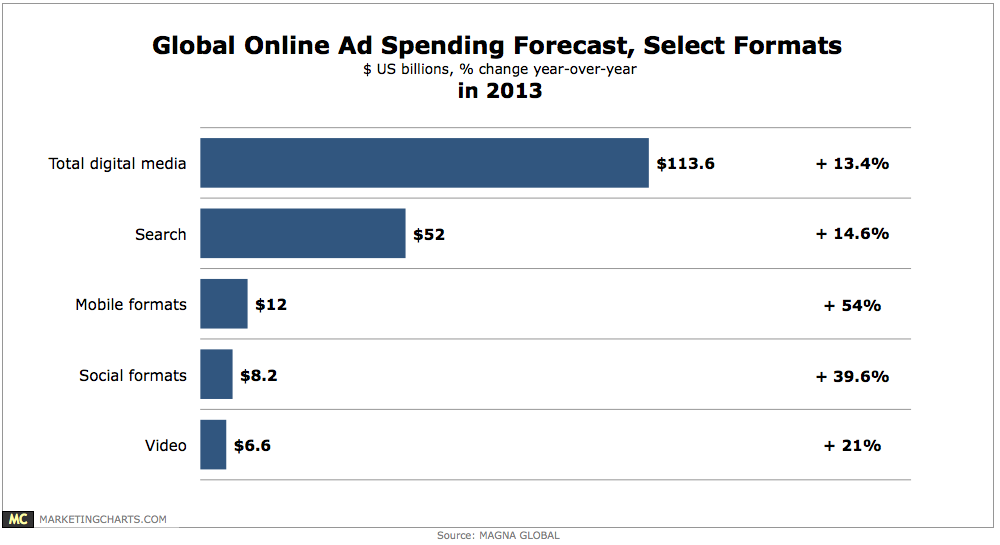
Read MoreGlobal Online Ad Spending Forecast By Format, 2013 [CHART]
Online ad spending around the world is projected to grow by 13.4% to reach $113.6 billion this year.
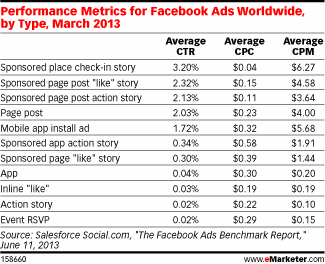
Read MoreGlobal Facebook Ad Performance Metrics By Type, March 2013 [TABLE]
The sponsored check-in story achieved the highest clickthrough rate (CTR) by a significant margin.
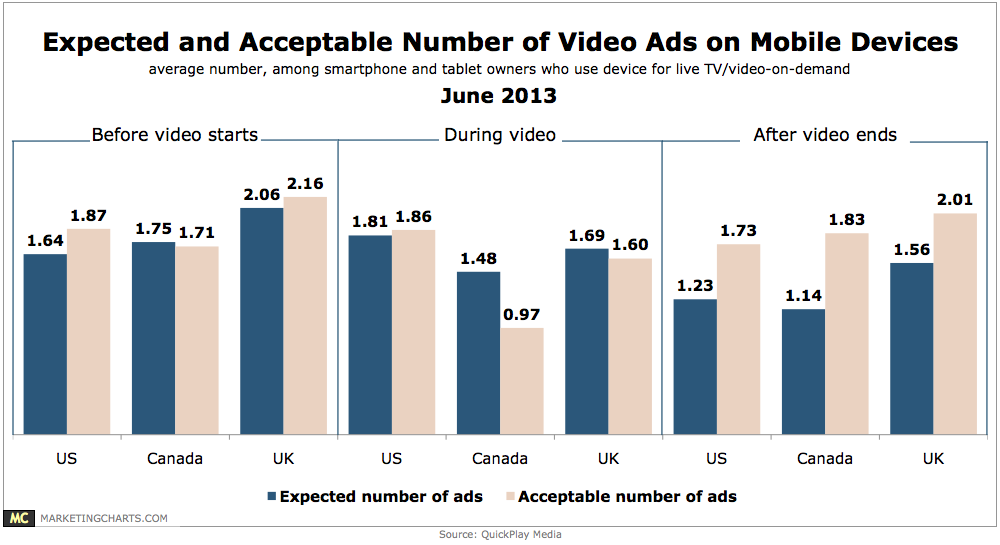
Read MoreExpectation & Tolerance For Mobile Video Ads, June 2013 [CHART]
Research from comScore has shown that the average TV show is about one-quarter ads, while new figures from comScore indicate that online video ads accounted for just 2.6% of all minutes spent watching online video last month.
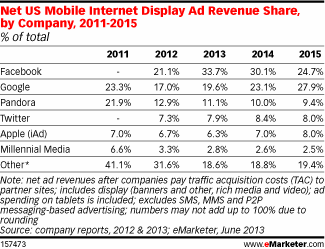
Read MoreUS Mobile Display Ad Revenues By Company, 2011-2015 [TABLE]
Facebook is the leading player and will rake in just over one in three mobile display dollars this year, after traffic acquisition costs (TAC).
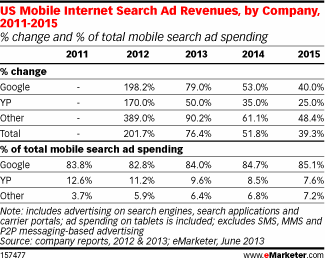
Read MoreUS Mobile Search Ad Revenues By Company, 2011-2015 [TABLE]
Google alone took in 82.8% of all mobile search ad revenues last year.
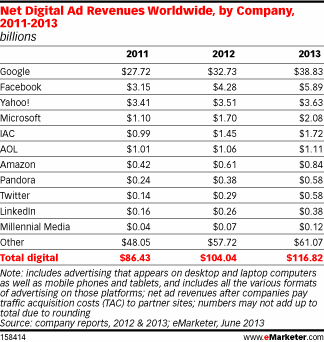
Read MoreGlobal Net Online Ad Revenues By Company, 2011-2013 [TABLE]
Both Google and Facebook are increasing revenues at faster rates than the overall digital ad spend market.
Read More