Mobile Advertising
Global Mobile Ad Spending Share By Region, 2011-2017 [TABLE]
This year, eMarketer expects, 18.8% of all digital ad spending in North America will go toward mobile internet ads.
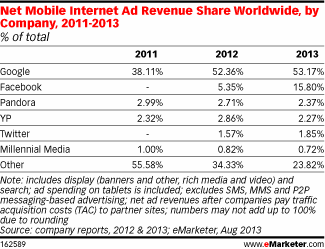
Read MoreNet Mobile Ad Revenue Share By Company, 2011-2013 [TABLE]
The company is expected to see its share of global mobile internet ad revenues reach 15.8% this year, up from just 5.35% in 2012.
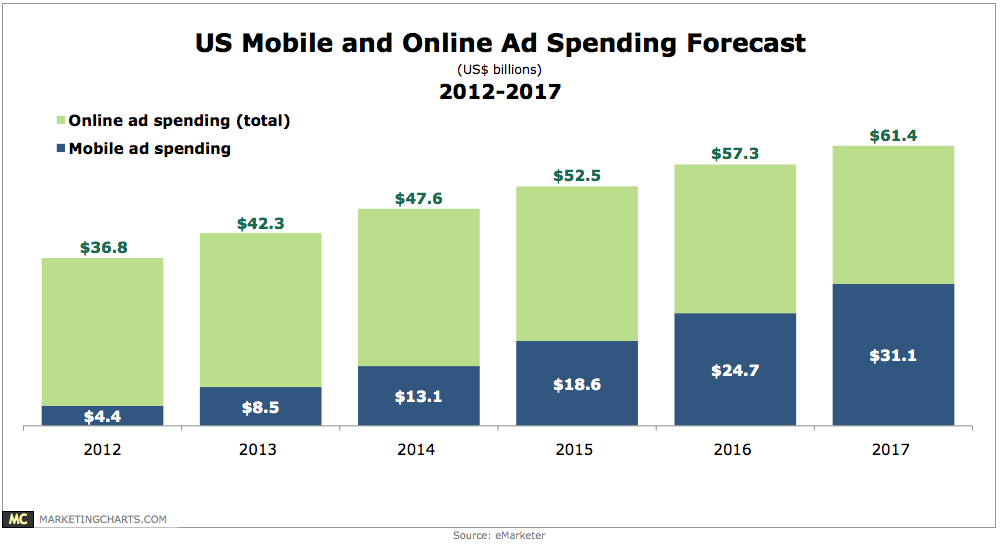
Read MoreUS Mobile & Online Ad Spending, 2012-2017 [CHART]
Mobile will capture a slight majority of US online ad spending in 2017.
Read MoreUS Mobile Display Ad Spending, 2011-2017 [CHART]
Mobile internet display ad spending will amount to $3.81 billion this year—up 21.7% from 2012.
Read MoreUS Total Ad Spending By Media, 2011-2017 [TABLE]
eMarketer expects TV to continue to capture the largest share of paid ad spending in the US for the foreseeable future, though its percentage of total spending will drop slightly, from 39.1% in 2012 to 38.8% this year.
Read MoreUS Mobile Ad Spending, 2011-2017 [TABLE]
Mobile spending is expected to rise 95.0% this year to account for 20.1% of all digital ad spending, and 5.0% of total media ad spending.
Read MoreUS Digital Ad Spending By Format, 2011-2017 [TABLE]
This year, 21.7% of all digital display ad spending will be on mobile, rising to 48.4% by 2017.
Read MoreUS Mobile Ad Spending By Format, 2011-2017 [TABLE]
In 2010, just 2.1% of all digital search ad dollars were spent on mobile devices. This year, that share will reach 22.1%.
Read MoreMobile Advertisers' Use Of Geo-Precise Targeting Techniques, Q2 2012 – Q2 2013 [CHART]
90% of national brand advertising campaigns employed geo-precise targeting (targeting areas that do not conform to standard geo-boundaries) in Q2.
Read MoreAdvertising Tactics Brand Marketers Plan To Use More, February 2013 [CHART]
US brand marketers, in particular, will double down on social media, mobile and video this year, with 70%, 69% and 64%, respectively, increasing their use of these tactics.
Read More
