Mobile Advertising
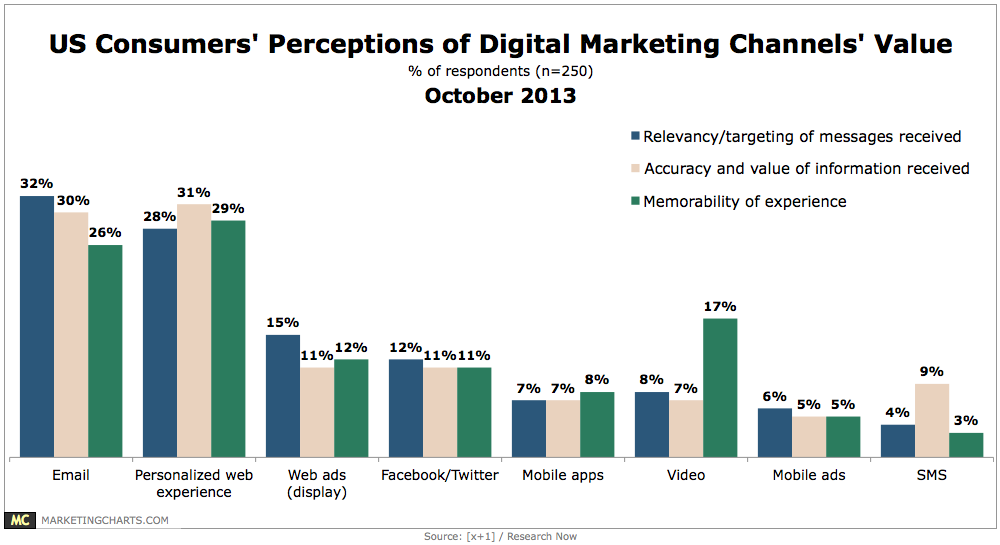
Consumer Perceptions Of Online Marketing Channels' Value, October 2013 [CHART]
79% pointed to web personalization as worth the effort.
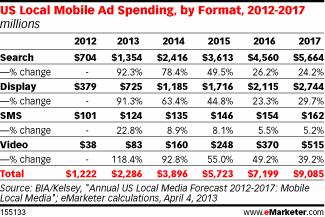
Read MoreUS Local Mobile Ad Spending By Format, 2012-2017 [TABLE]
BIA/Kelsey estimated advertisers in the US would invest $725 million in local mobile display advertising in 2013, which is nearly twice the amount spent last year.
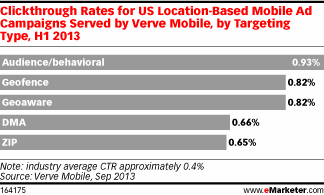
Read MoreClick-Through Rates For Location-Based Ads By Targeting Type, H1 2013 [CHART]
The use of geotargeted mobile display advertising is on the rise, as are campaign results.
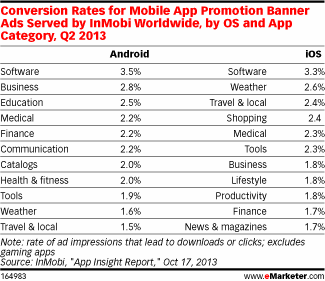
Read MoreConversion Rates For Mobile App Promotion Banner Ads By OS & App Category, Q2 2013 [TABLE]
Software apps had the highest conversion rates for banner ads on both Android devices and those running iOS.
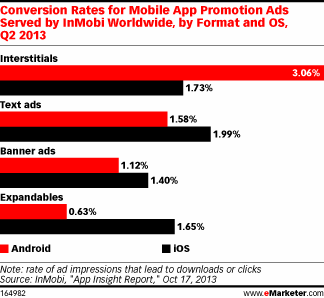
Read MoreConversion Rates For Mobile App Promotion Ads By Format & OS, Q2 2013 [CHART]
Interstitials advertising mobile apps garner a conversion rate of just over 3% on devices running Google’s Android operating system.
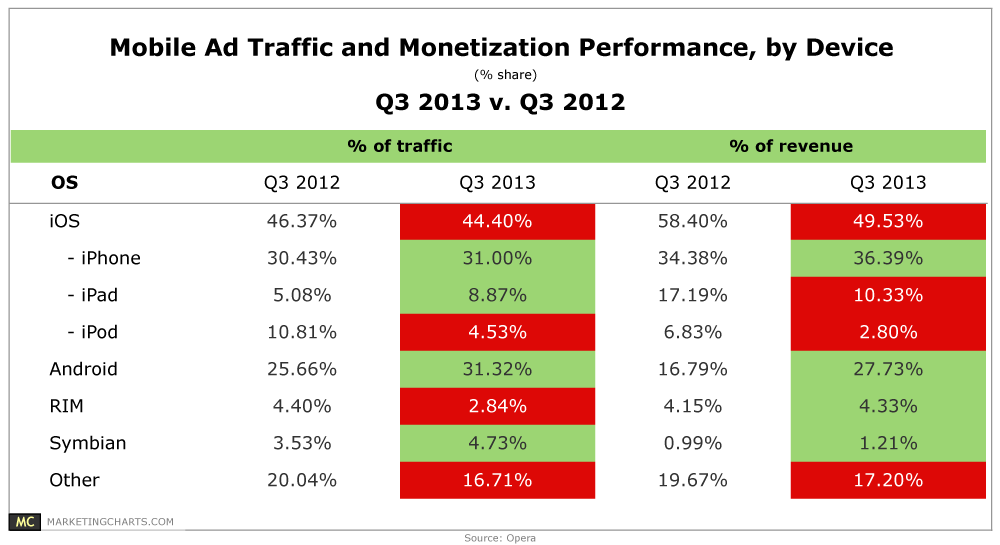
Read MoreMobile Ad Traffic & Monetization Performance By Device, Q3 2012 vs Q3 2013 [CHART]
Among mobile platforms, Apple’s iOS continues to outpace Android in monetization performance on the Opera Advertising mobile platform.
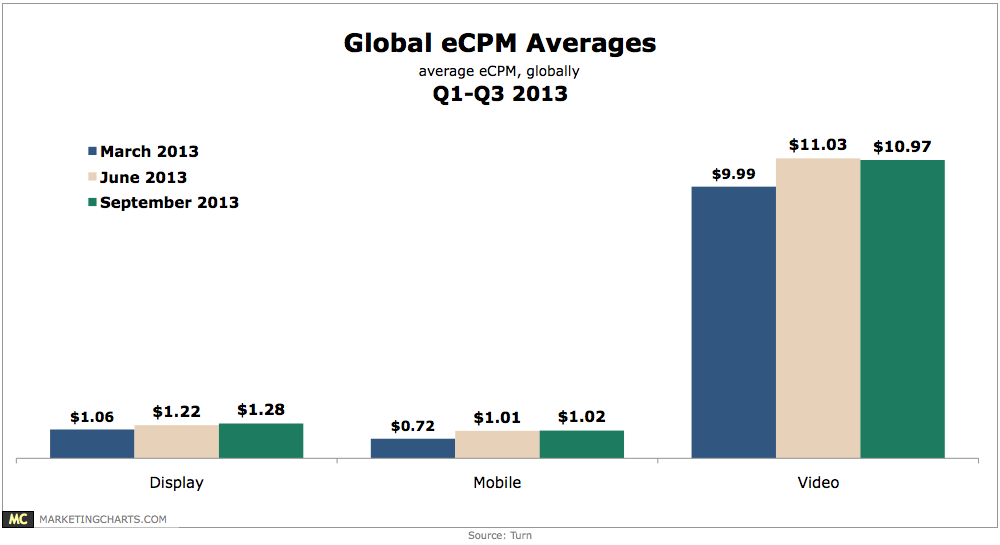
Read MoreGlobal eCPM Averages, Q1-Q3 2013 [CHART]
Global eCPM averages remained fairly steady on a quarter-over-quarter basis across display, mobile, and video channels, particularly when compared to trends from prior quarters.
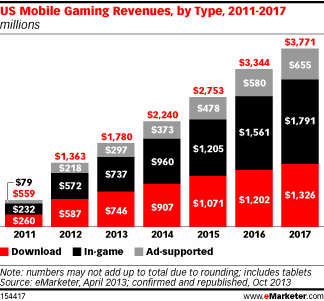
Read MoreUS Mobile Gaming Revenues By Type, 2011-2017 [CHART]
eMarketer estimates the number of US mobile phone gamers will reach 125.9 million in 2013.
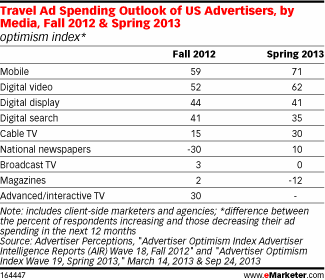
Read MoreTravel Ad Spending Outlook By Media, Fall 2012 & Spring 2013 [TABLE]
Travel in-stream video ads led all industries in 2012 with a 1.47% click-through rate.
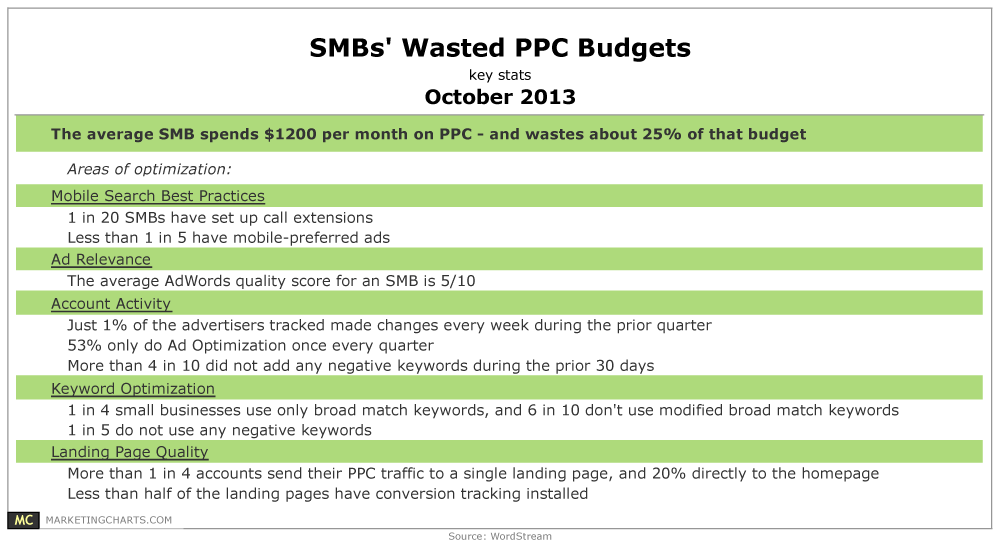
Read MoreSMBs' Wasted PPC Budgets, October 2013 [TABLE]
An analysis of 500 SMB AdWords accounts suggests that the average small business spends $1,200 on PPC and wastes more than one-quarter of that total.
Read More