Mobile Advertising
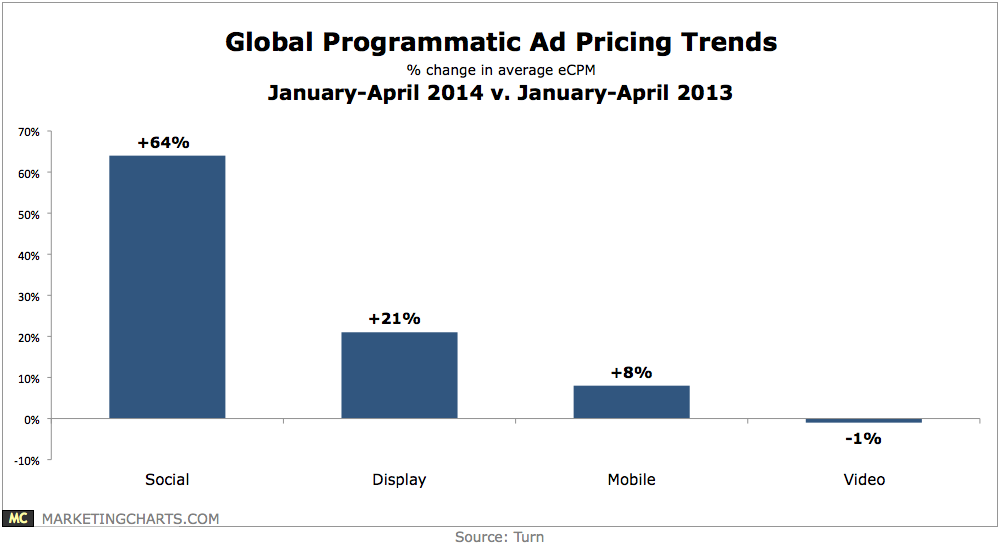
Global Programmatic Ad Pricing Trends, 2013 vs 2014 [CHART]
Social and display advertising have become more competitive and seen a 64% and 21% year-over-year increase, respectively, in average eCPM from January through April 2014.
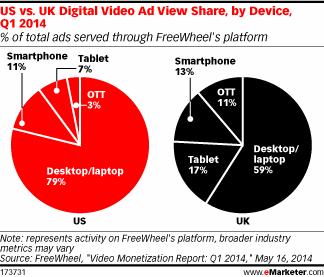
Read MoreUS vs UK Video Ad View Share By Device, Q1 2014 [CHART]
Tablets accounted for 17% of total digital video ad views (of ads served through the company’s network) in the UK in Q1 2014.
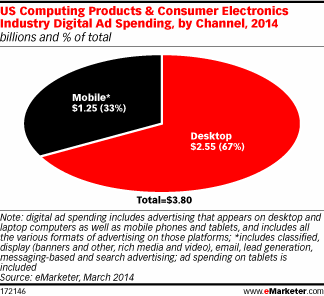
Read MoreUS Consumer Electronics Online Ad Spending By Device, 2014 [CHART]
eMarketer expects 33% of the industry’s digital ad spending to go to mobile in 2014.
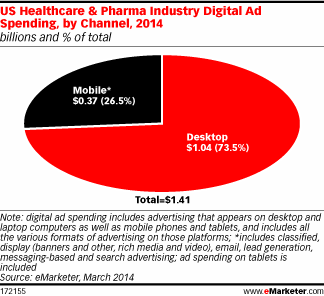
Read MoreUS Health Care & Pharmaceuticals Online Ad Spending By Device, 2014 [CHART]
Health and pharma companies will spend just $373 million, or 26.5% of total digital ad spending.
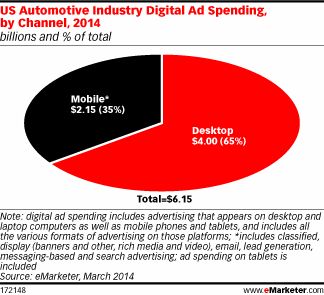
Read MoreUS Automotive Online Ad Spending By Device, 2014 [CHART]
More than one-third (35%) of US automotive-related digital ad spending will be on mobile this year.
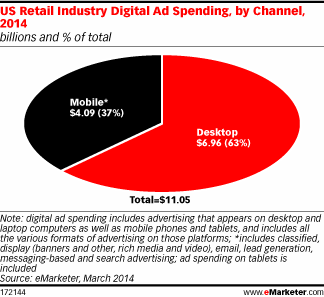
Read MoreUS Retail Online Ad Spending By Device, 2014 [CHART]
Consumers’ widespread use of mobile devices is helping drive retail’s turn to digital media.
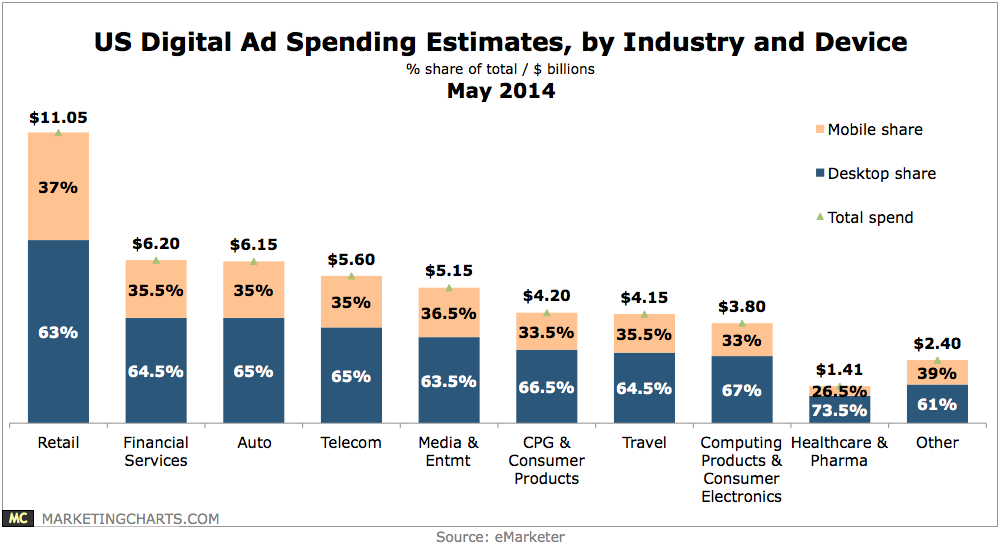
Read MoreUS Online Ad Spending Estimates By Industry, May 2014 [CHART]
Mobile accounts for slightly more than 35% of digital ad budgets this year.
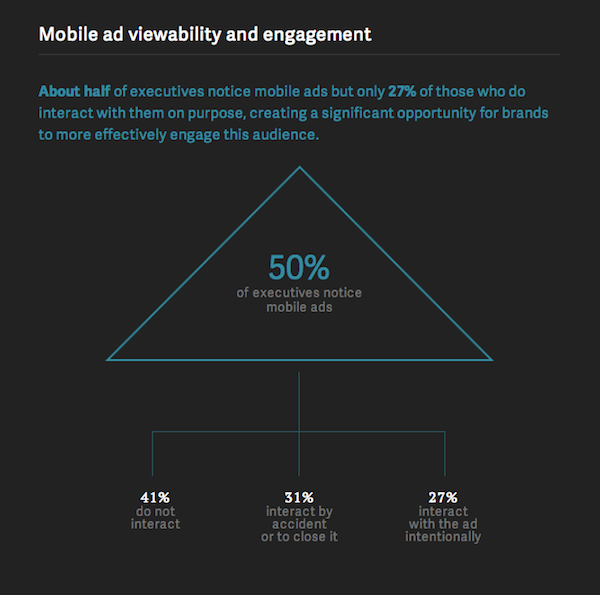
Read MoreMobile Ad Viewability & Engagement Among Executives [CHART]
58 percent of executives said desktop ads were more memorable.
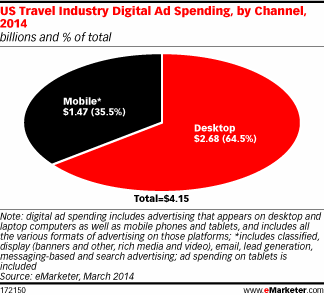
Read MoreUS Travel Industry Online Ad Spending By Channel, 2014 [CHART]
Mobile spending will make up 35.5% of the US travel sector’s $4.15 billion in digital ad investments in 2014 as travel marketers make changes to deal with high mobile device usage.
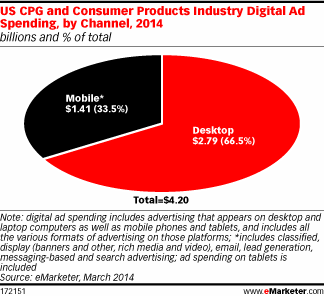
Read MoreUS CPG & Consumer Products Online Ad Spending By Channel, 2014 [CHART]
CPG’s share of spending on mobile is on the low end—just 7.9% of total mobile spending—compared with other industries such as retail, financial services and automotive.
Read More