Mobile Advertising
Tablet Magazine Ad Recall, July 2014 [TABLE]
When asked about a specific ad, 52% of tablet magazine readers recalled seeing (or Noted) the ad.
Read MoreUS Online Ad Spending By Channel, 2012-2018 [TABLE]
Strong, steady growth in mobile advertising will push digital ads to represent nearly 30% of all US ad spending this year.
Read MoreTotal US Ad Spending Share By Media, 2012-2018 [TABLE]
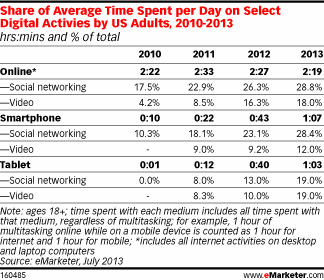
US adults will spend an average of 2 hours 51 minutes per day with mobile devices this year.
Read MoreMobile Advertisers’ Campaign Goals, Q1 2014 [CHART]
A plurality 34% of mobile campaigns on the Millennial Media network counted site/mobile traffic as their goal, with brand awareness and engagement (23%) the second-most popular goal.
Read MoreTolerance Toward In-App Marketing In Exchange For Free App, January 2014 [CHART]
Though 63% of US smartphone app users said they knew mobile ads were necessary, they were far more likely to prefer rewards: 84%.
Read MoreMobile In-App Ad Preferences, March 2014 [CHART]
More than two-thirds of US smartphone owners surveyed said that if they had to see in-app advertising, being offered a reward for viewing or engaging with an ad was their top preference.
Read MoreLevels Of Suspicious US Web & Mobile Traffic, Q1 2013 – Q1 2014 [CHART]
Suspicious US web traffic was down from a high of 61% in Q4 to 55% in Q1, which Solve Media attributes to lower ad spending after the holiday season.
Read MoreGerman Ad Spending By Media, 2010-2013 [TABLE]
German ad spending is expected to rise 2% in 2014.
Read MoreMarketing Expenditures In The Next 5 Years [INFOGRAPHIC]
This infographic is based on data from an Accenture CMO study and illustrates where they thing their marketing dollars will be spent in the next five years.
Read MoreShare Of Programmatically Sold Advertising In Netherlands, February 2014 [CHART]
Publishers in the Netherlands expected to sell 86% of both mobile and tablet ads programmatically in five years.
Read More