Media Consumption
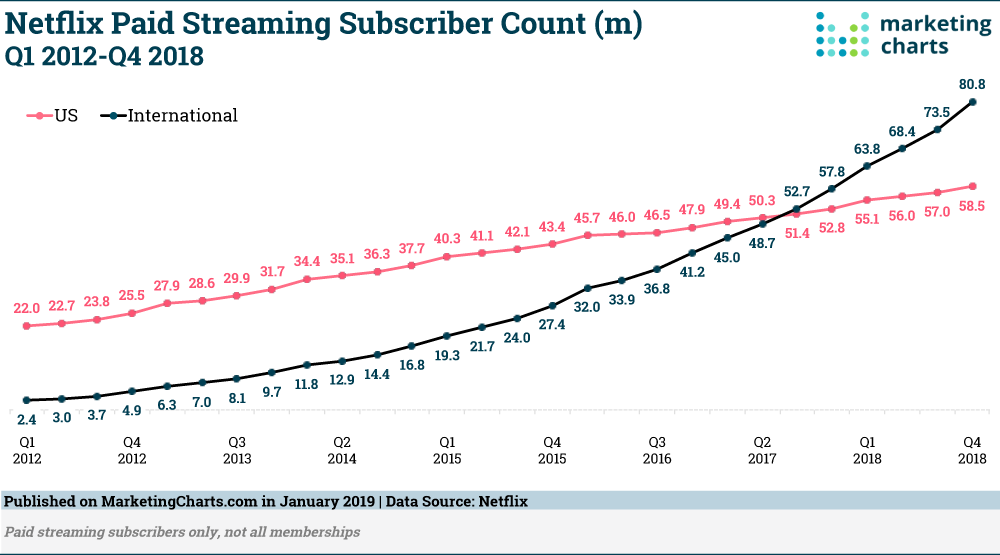
Netflix Paid Streaming Subscribers, 2012-2018 [CHART]
Netflix’ subscriber growth rate remains constant. Looking at the trend from Q2 2012 through Q4 2018, the cumulative trendline appears solidly consistent.
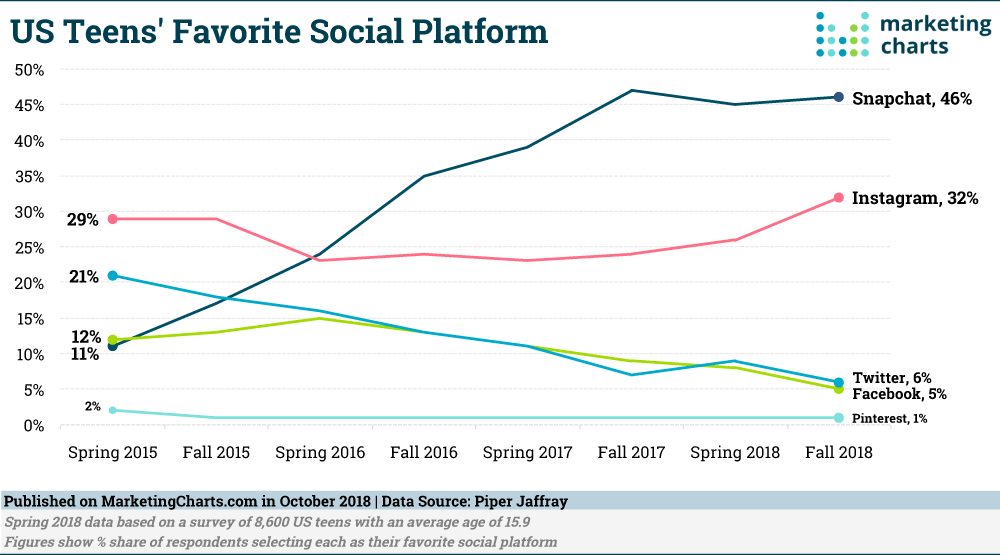
Read MoreGeneration V's Favorite Social Platforms, 2015-2018 [CHART]
Snapchat has reigned supreme as teens’ favorite social platform for a couple of years now, according to Piper Jaffray’s semi-annual teen surveys.
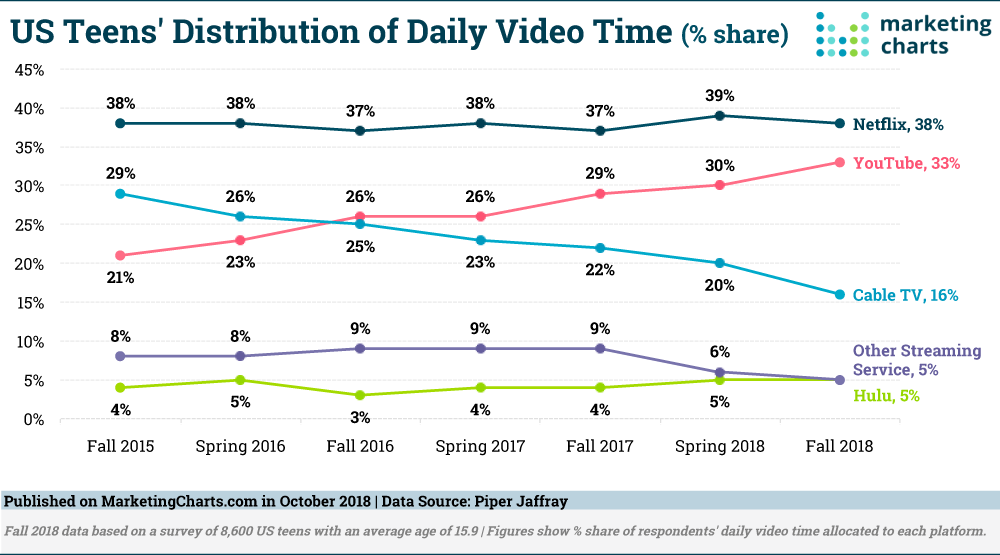
Read MoreGeneration V Daily Video Consumption [CHART]
The 8,600 Generation V members surveyed estimated spending less than one-sixth (16%) of their daily video time watching cable TV, down from 23% a year earlier.
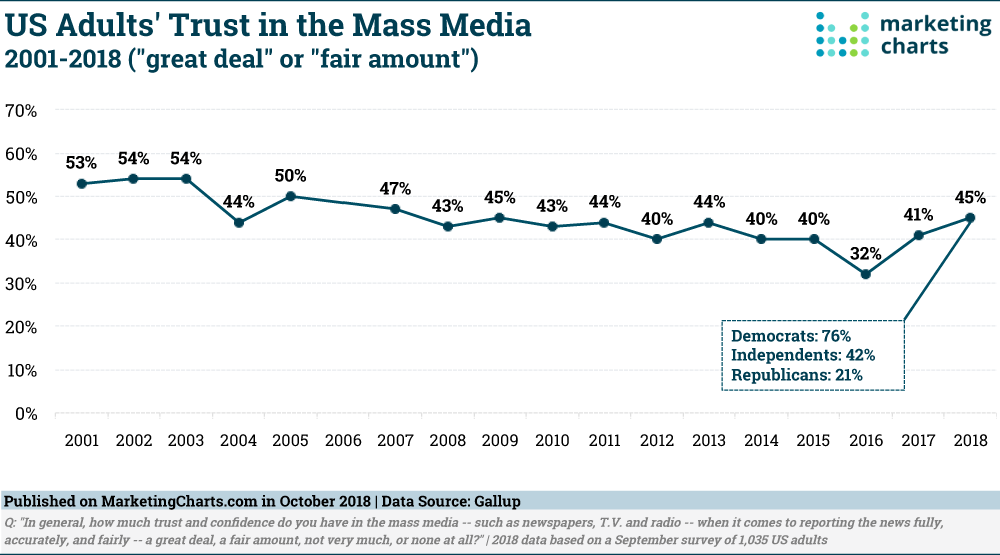
Read MoreAmericans' Trust In Mass Media, 2001-2018 [CHART]
Almost half (45%) of American adults now trust the mass media, representing an uptick from 41% last year and a low of 32% in 2016, per survey results from Gallup.
Read MoreVideo Marketing Statistics [INFOGRAPHIC]
This infographic from Renderforest illustrates 47 video marketing statistics to help you think through your video marketing strategy.
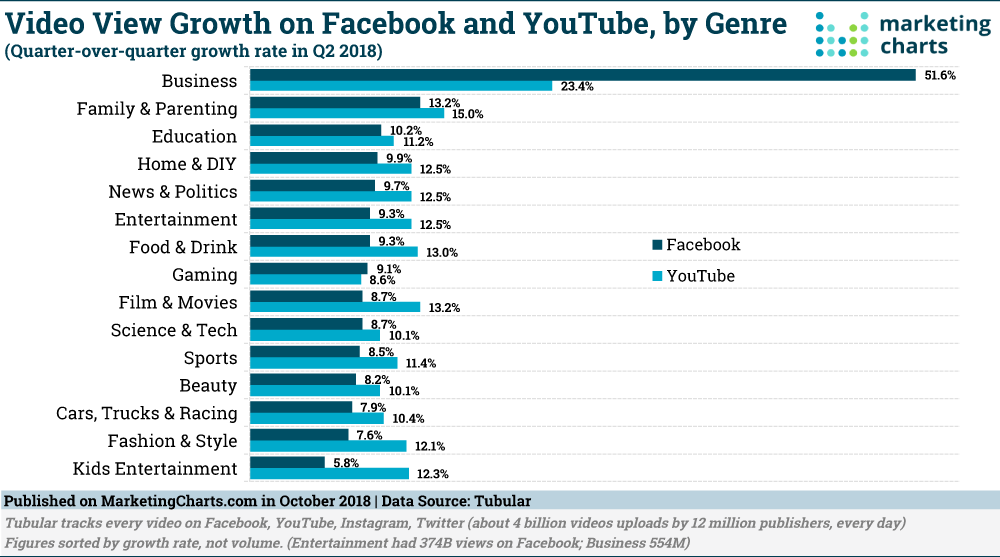
Read MoreVideo View Growth On Facebook & YouTube [CHART]
YouTube and Facebook – the two most popular social media sites in the US – are commonly seen as more consumer-oriented than other, more business-oriented sites such as LinkedIn.
Read MoreMedia Consumption Of Millennials & Generation V [INFOGRAPHIC]
This infographic from VisionCritical compares the media consumption of Millennials to that of Generation V.
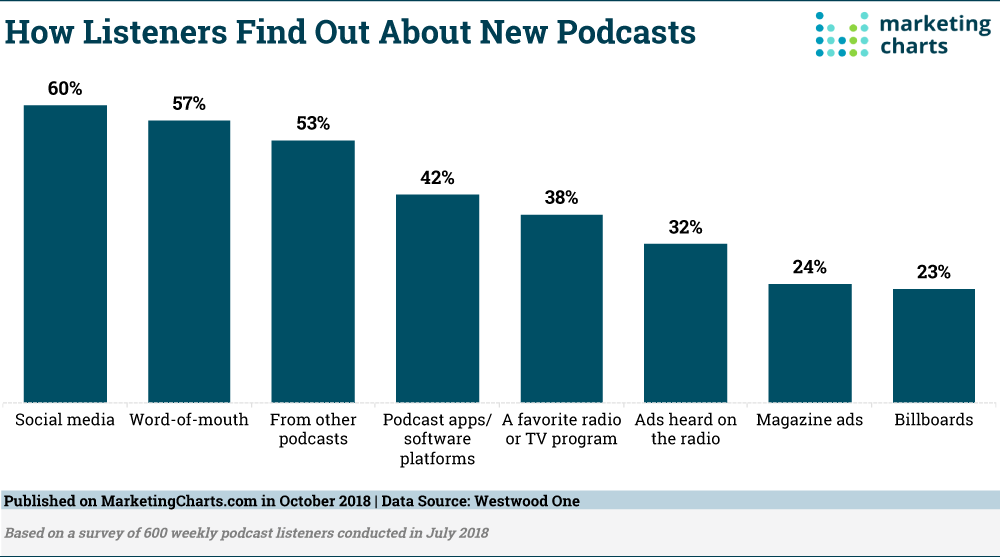
Read MorePodcast Discovery Channels [CHART]
The podcast audience is growing, and people are becoming heavier listeners over time.
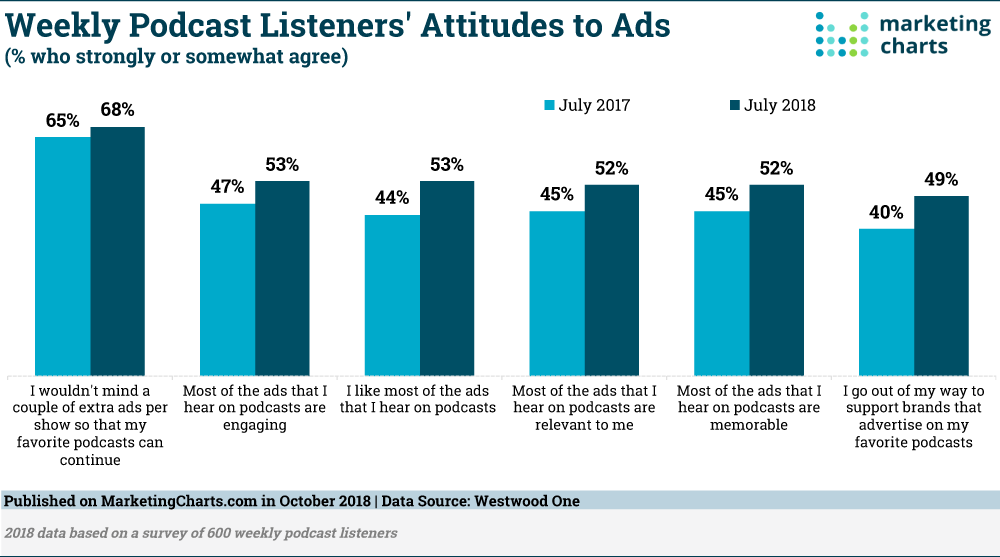
Read MorePodcast Listeners' Attitudes Toward Ads [CHART]
More than one-sixth (17%) of the US population listens to podcasts on a weekly basis, and it seems that weekly podcast listeners are tuning in more often than they used to.
Read MoreEmail Design & Attention Spans [INFOGRAPHIC]
The average time spent reading an email increased nearly 7% over the past six years.
Read More