Media Consumption
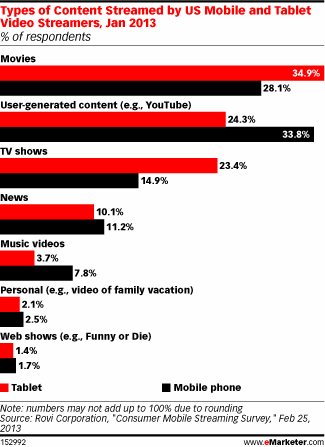
Types Of Streamed Mobile Video By Device, January 2013 [CHART]
The top three kinds of content for both smart phone & tablet users were movies, user-generated content (such as YouTube videos) and TV shows.
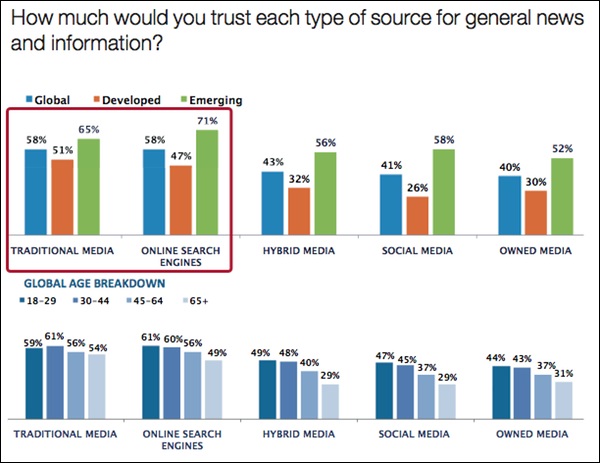
Read MoreTrusted Sources Of General News & Information [CHART]
Trust in media is up five percent over last year, with search engines and traditional media topping the list: 58 percent overall said they trust those sources for news and information.
Read MoreOnline News Video Eyetracking [HEATMAP]
This heatmap from EyeTrackShop illustrates where people focus their attention on online news video using an example from CNN.
Read MoreMethods Online Americans Use To Watch TV, June 2012 [CHART]
Over half of respondents streamed via a PC, nearly half streamed through an internet-connected device, and 29% streamed through a mobile device.
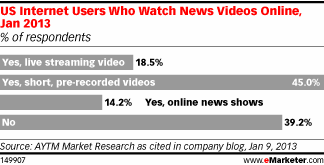
Read MoreUS Internet Users Who Watch News Videos Online, January 2013 [CHART]
More than half of internet users surveyed said they watched news clips online—45% watched short video clips, 19% live-streamed video, and 14% viewed full online news shows.
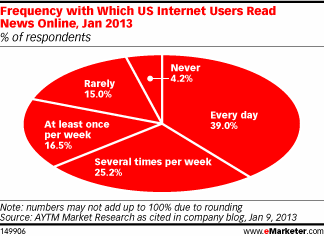
Read MoreFrequency With Which Americans Read News Online, January 2013 [CHART]
39% of respondents said they read online news every day, only 25% said they watched cable TV news every day.
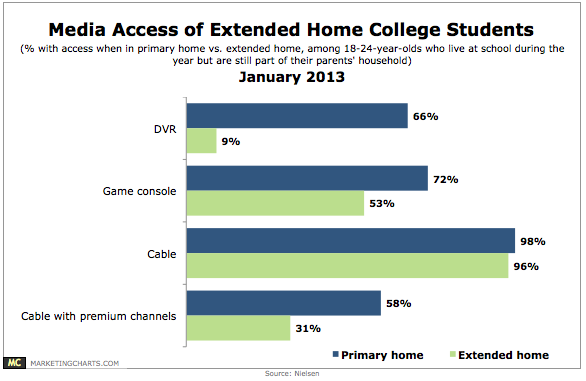
Read MoreCollege Student Access To Select Media By Channel, January 2013 [CHART]
The 18-24 demographic is watching slightly less TV these days, and concurrently watching more internet and mobile video.
Read MoreMedia Consumption Of Mobile News App Users, June 2012 [TABLE]
70% of mobile news app users got their news digitally, nearly twice as many as among mobile internet users who had not downloaded a news app.
Read MorePrimary News Sources Of Mobile Users, September 2012 [TABLE]
A June survey from Pew put digital just 16 percentage points behind TV as the source where US news consumers got their news.
Read More