Media Consumption
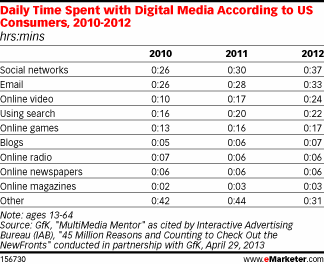
Americans' Daily Time Spent With Digital Media, 2010-2012 [TABLE]
US consumers spent an average of 37 minutes daily on social networks in 2012.
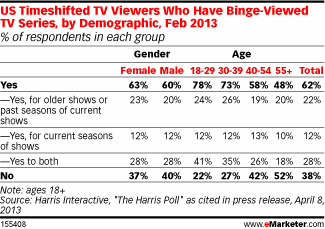
Read MoreBinge TV Viewing Behavior By Demographic, February 2013 [TABLE]
62% of people watched multiple episodes of a TV show in succession, also known as “binge-viewing.”
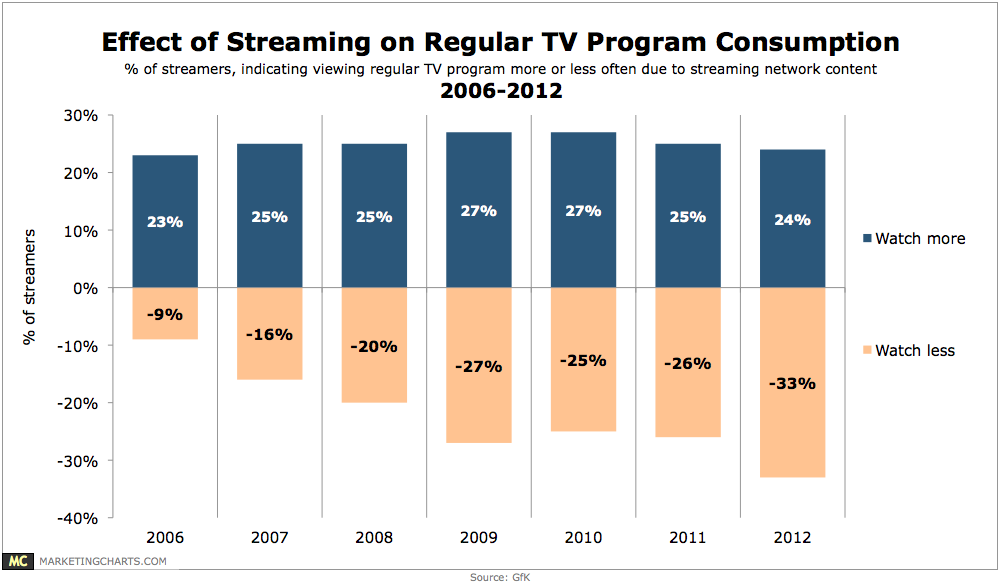
Read MoreEffect Of Streaming Video On Traditional TV Consumption, 2006-2012 [CHART]
34% of US internet users (and 30% of all consumers aged 13-54) surveyed in December 2012 reported having watched streaming video content that originated from a network since the beginning of September.
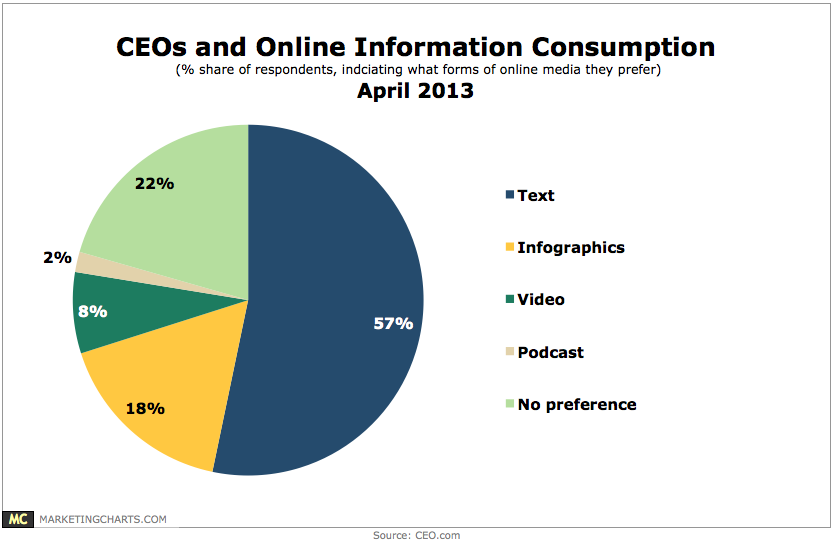
Read MoreOnline Media Consumption Of CEOs, April 2013 [CHART]
3 in 4 CEOs aged under 50 say they “mostly consume information online,” and close to 2 in 3 aged over 50 agree.
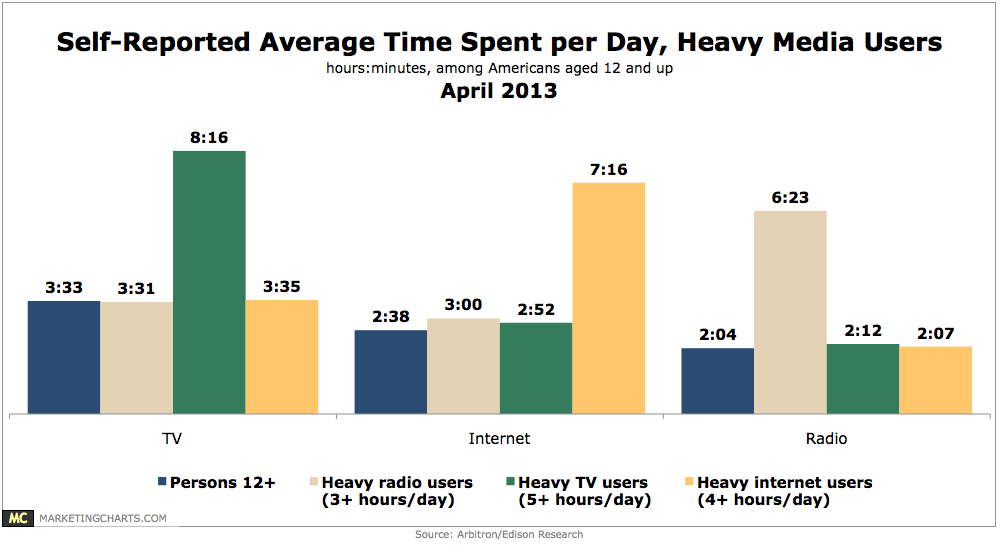
Read MoreTime Spent Consuming Media By Select Channels, April 2013 [CHART]
Heavy usage of one of the top 3 media (by reach) does not necessarily mean that less time is spent with the other media.
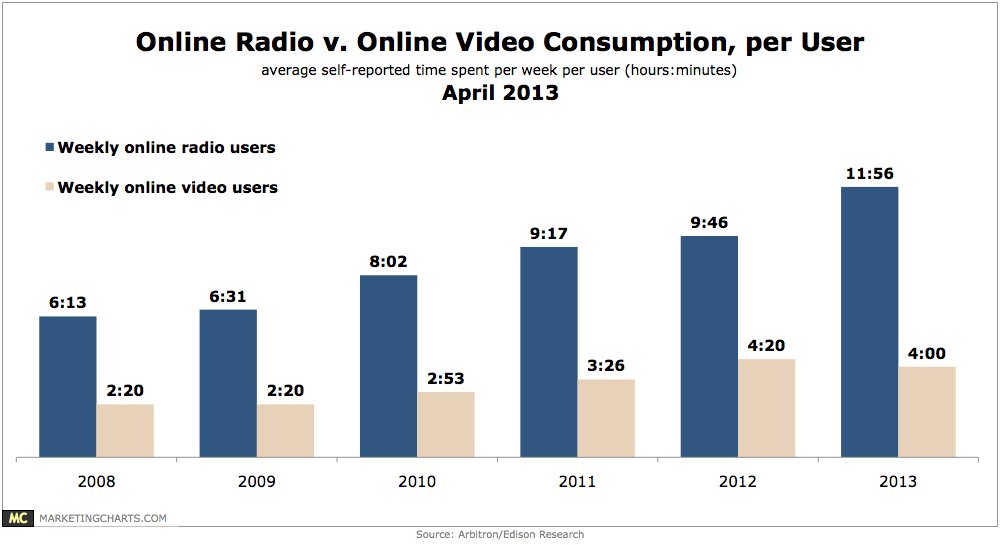
Read MoreOnline Radio vs. Online Video Consumption, April 2013 [CHART]
Online radio is far ahead of online video in terms of weekly consumption.
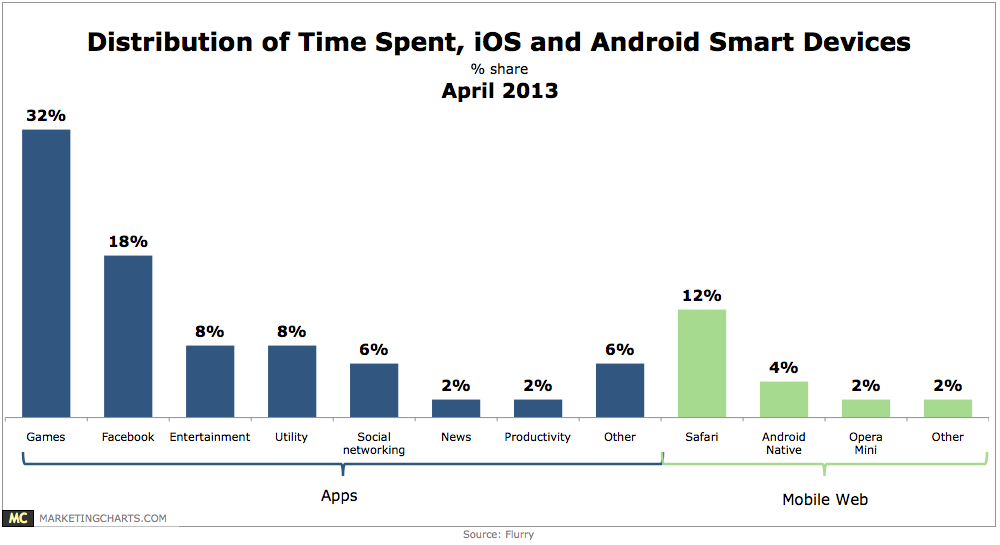
Read MoreTime Spent On iOS & Android Devices By Activity, April 2013 [CHART]
Android and iOS smart phone and tablet users spend an average of 2 hours and 38 minutes per day on their devices.
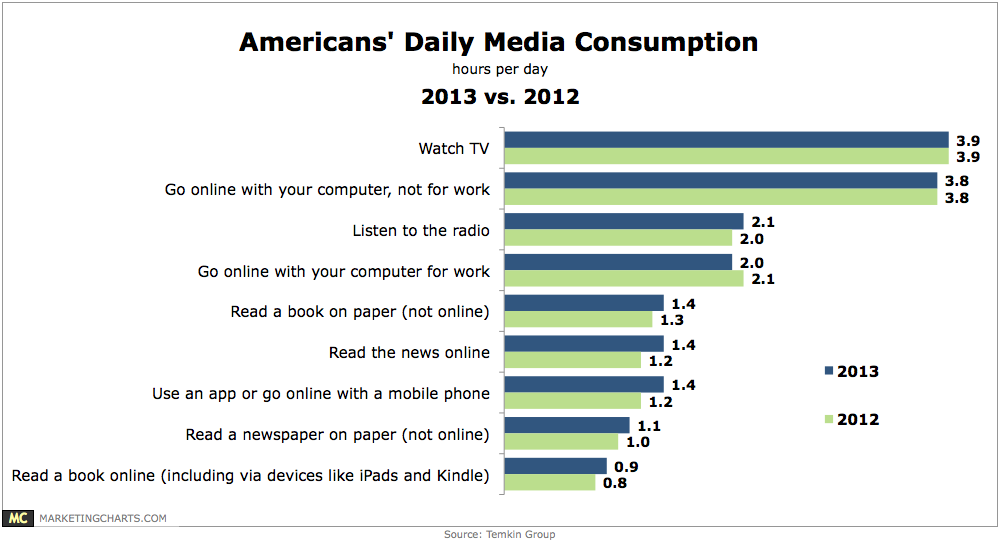
Read MoreAmericans' Daily Media Consumption, 2012 vs 2013 [CHART]
Americans are holding steady in terms of their TV consumption and non-work-related internet use, but are spending more time with other activities such as reading books and accessing the internet via a mobile device.
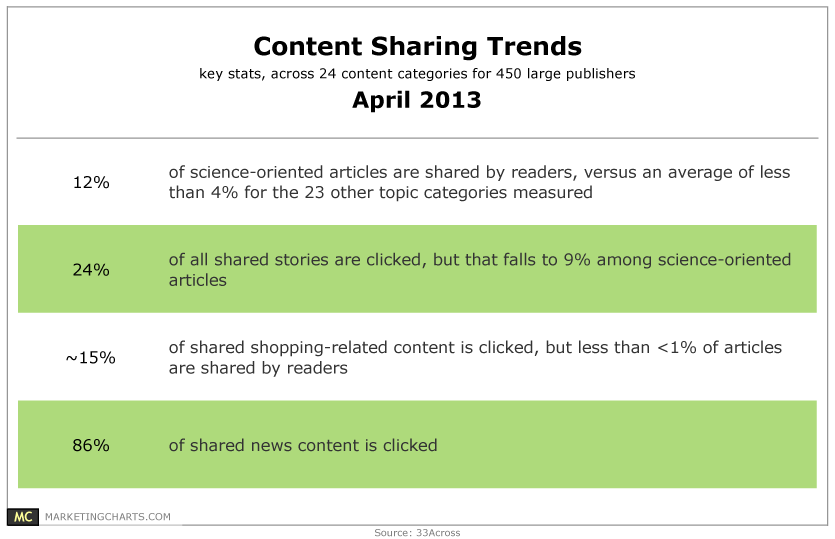
Read MoreContent Sharing Trends, April 2013 [TABLE]
The types of content that people share may be driven more by ego than anything else.
Read MoreGoogle Universal Search Results By Content Type, 2012 [CHART]
A new study show the visibility of Google Shopping in Google’s Universal Search results dropped significantly after the search engine implemented a new paid inclusion model.
Read More